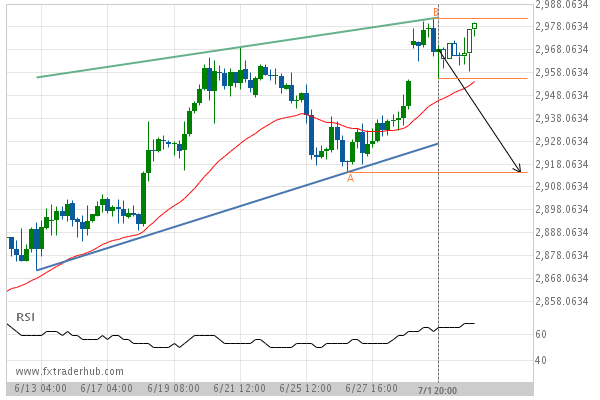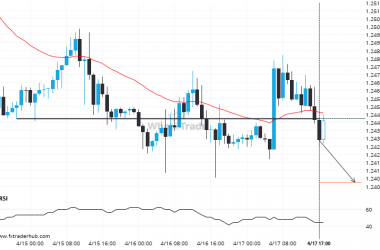
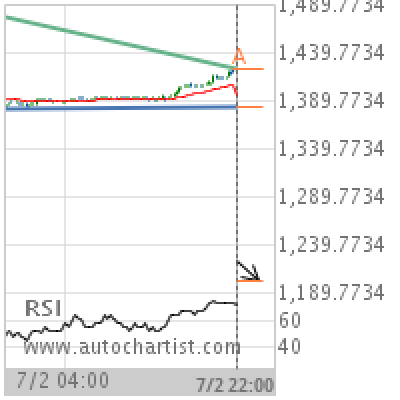

Descending Triangle has broken through the support line at 02-Jul-2019 22:00 UTC. Possible bearish price movement forecast for the next 13 hours towards 1202.5472. Supported by RSI above 60
Chart 15 Minutes
Pattern Descending Triangle
Length 150 Candles
Identified 02-Jul-2019 22:00 UTC