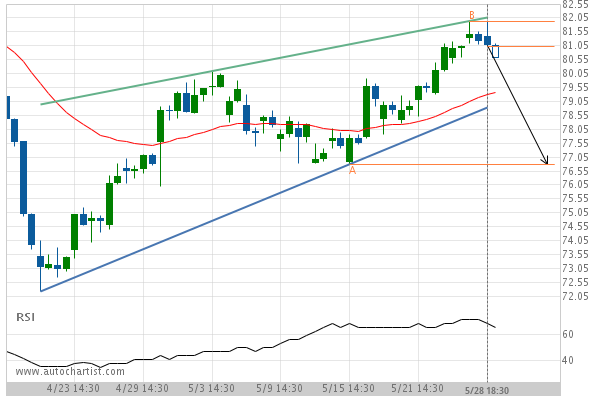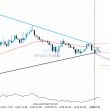
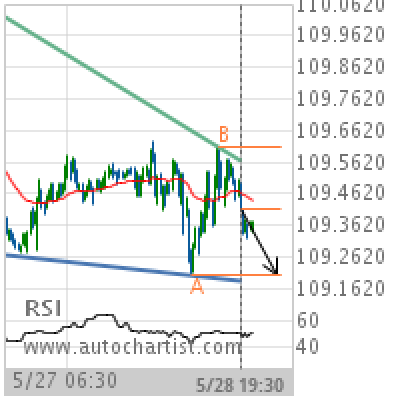

Falling Wedge identified at 28-May-2019 19:30 UTC. This pattern is still in the process of forming. Possible bearish price movement towards the support 109.2040 within the next day. Supported by Downward sloping Moving Average
Chart 30 Minutes
Pattern Falling Wedge
Length 169 Candles
Identified 28-May-2019 19:30 UTC