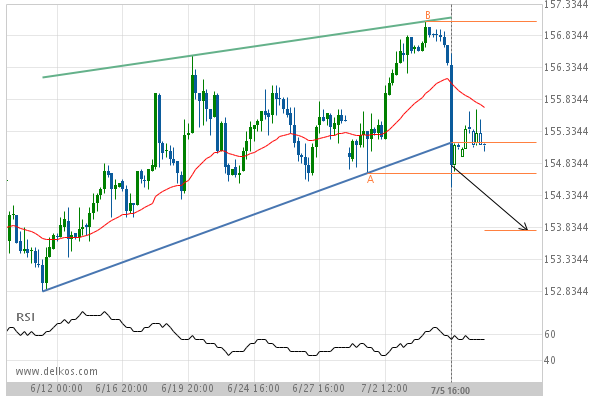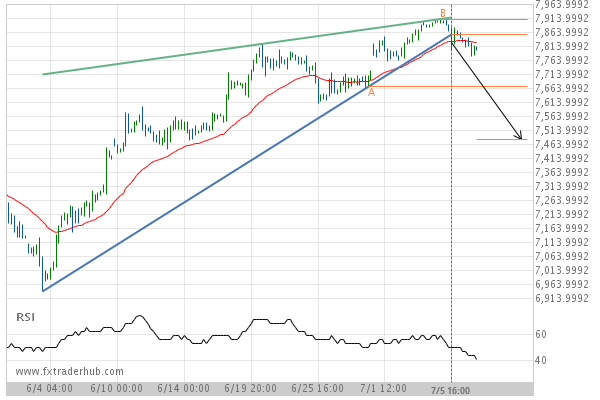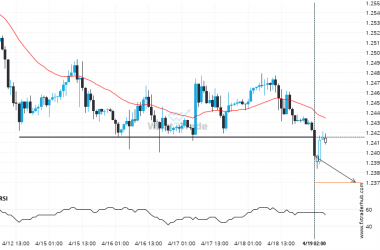
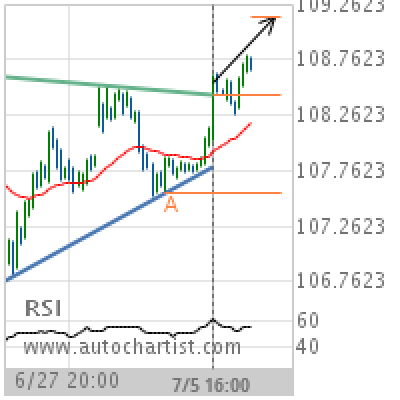

Triangle has broken through the resistance line at 05-Jul-2019 16:00 UTC. Possible bullish price movement forecast for the next day towards 109.1436. Supported by Upward sloping Moving Average
Chart 4 hour
Pattern Triangle
Length 87 Candles
Identified 05-Jul-2019 16:00 UTC