I always like to say, that in any trading strategy, you should only be exposed to the market when absolutely necessary. That is, whether it’s a strategy running on daily intervals or on monthly intervals, a trader should not stay in the market longer than needed because it leaves room for the unexpected. This is especially true when it comes to momentum strategies and it can be the difference between gain and pain. The Symmetrical Triangle strategy is one that is simple and effective enough to let you gain from momentum, without staying a second longer than necessary. The strategy relies on a pattern that, no surprise, is called the Symmetrical Triangle.
Symmetrical Triangle Pattern
So what is the symmetrical triangle pattern? Simply put, it is a pattern that enables you to buy into a correction and sell before the pair peaks again.
In order to identify a symmetrical triangle pattern, we have to watch for four unique yet symbiotic conditions.
- The pair has to be in a long term bullish trend.
- The pair has to be in the midst of a temporary correction.
- The correction has to be in the shape of a triangle with lower highs.
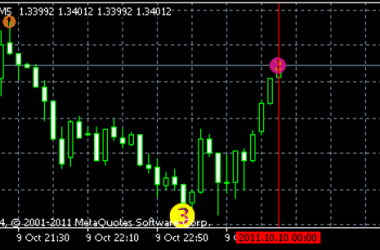
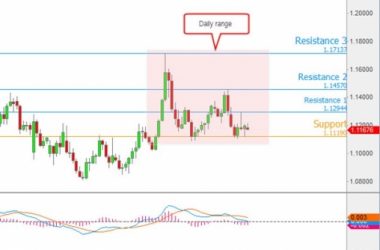
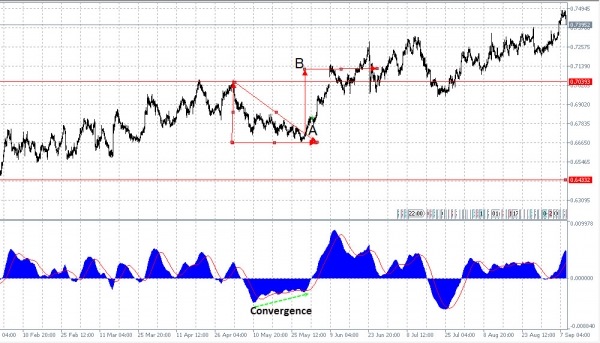
- The momentum of the correction has to converge with the oscillator, as seen in the MACD chart below.
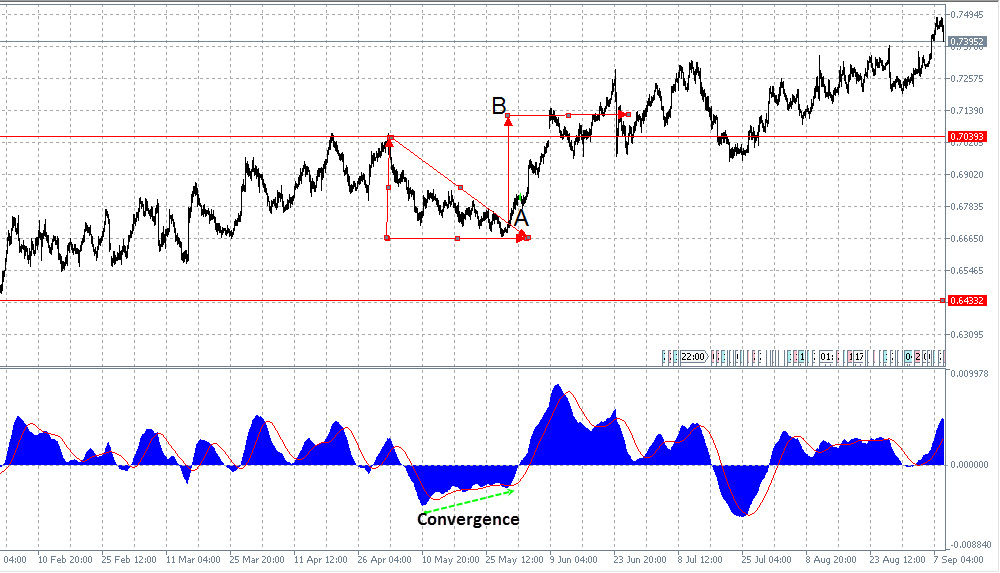
The buy signal comes at a very specific time. That is after the pair breaks the correction pattern and oscillator (in this case, the MACD) moves back above zero and ascends into buy territory.
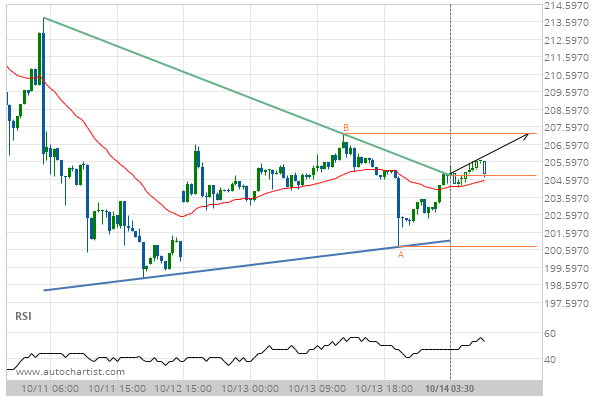
The symmetry of the triangle is what helps us determine our limit. The symmetry does not have to come in the shape of a symmetrical triangle on the upward move. In fact, only one element should be symmetrical—the highs. The highs from where the pair breaks the correction pattern (see point A) should be identical to the highs of the triangle.
Using the grid to measure the height, if the height of our triangle is three and a half squares we should stretch point A three and a half squares to point B.
The Idea Behind the Strategy
So what is the idea behind the Symmetrical Triangle?
To get the answer, we need to start with the end result.
The chart shows that the pair has continued above point B (which was our target), yet the symmetry rule made us exit the trade early. Why? The idea is that when you have a triangle break that fulfilled the aforementioned conditions it tends to generate a move higher, at least the same height as the triangle from the point of the break. If, for example, the bullish trend would have been over, the pair would have topped out a little above point B. But if we were targeting G, a higher point, and stayed too long, we could have ended up with pain rather than gain. But the symmetry method allows us to take a profit even if the pair was about to top out and reverse.
When we add the entry methodology that allowed us to enter the trade early with minimal risk the picture become clear. The symmetrical triangle is an “in and out quick” strategy that minimizes risk in both directions. The entry is right at the bottom of the correction and the exit point is distant enough to make it a worthwhile trade and quick enough to avoid a potential trend reversal.
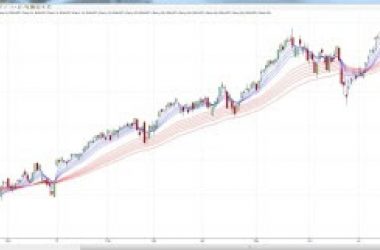
Before You Start
Of course, as with any strategy, including the Symmetrical Triangle, there is no singular perfect strategy that can always guarantee profit. The major downside to the Symmetrical Triangle strategy is that the pattern does not occur every time. For example, in the waves that followed we can see there were no lower tops when the pair corrected, just a steep descent towards the support line. That means that the Symmetrical Triangle is a low frequency strategy—it provides an entry signal only every once in a while. Naturally, that means you cannot rely on this strategy alone for profits because it may take time between each opportunity. But, when balanced with other strategies, the Symmetrical Triangle can certainly spice up your results and allow you to improve your trading performance each time it produces a burst of momentum.