I offer every novice trader I meet one invaluable piece of advice and that is that markets have a pulse. When you trade, whether it’s the EURUSD pair or Gold or any other asset, there is a certain spiral-like cycle, with constant contraction and expansion. Identifying the waves of contraction and expansion is a powerful tool that lets you identify long term trends and trade them effectively. The key to understanding contraction and expansion rests with one of the most popular tools in the world of trading—Fibonacci retracement.
The concept of contraction and expansion is simple; each wave of price movement is either an expansion of price range or a contraction of the wave before it. An expansion is a bullish sign, with prices expanding upward, while a contraction is a bearish sign, with prices contracting downward. 50% of the Fibonacci retracement of each wave compared with the next allows us to compare how each wave is stacked against the other, i.e. wider (expanding) or narrower (contracting). And this allows us to ultimately decide the price pattern we are looking at, either as a contracting spiral or an expanding one. Notice that, here, we do not use the Fibonacci as an indicator to forecast possible corrections but to measure the size of each wave.
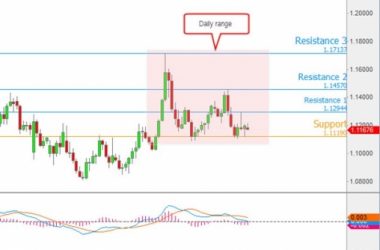
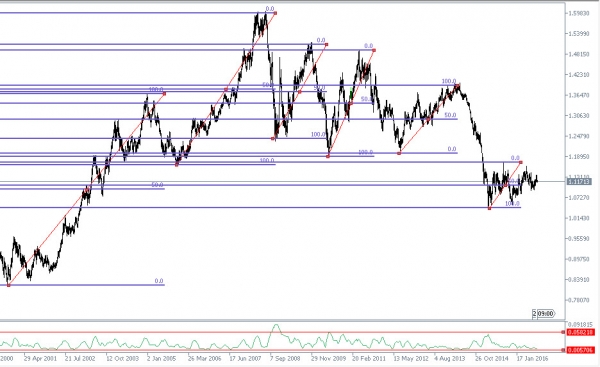
As seen below in the EURUSD chart, we have stretched a Fibonacci retracement from the bottom of each wave to the top and left only the 50% level. The rule of thumb is simple; we compare the 50% level of each wave to the one before and the one after. If the 50% of the wave is higher than the one before, this is an expansion. If we look closely and stretch a line from all the 50% levels, we can see some sort of a spiral shape which, in this case, is a contracting spiral.

Trade the Spirals
So how would one use spirals of contraction and expansion? It can either be used as a contrarian tool or as a validation tool.
The contrarian use of spirals is simple and perhaps the most effective. Looking at the sample above, we can see that the 50% level of the third wave is suddenly below the 50% Fibonacci of the second wave. That is a signal that a contracting spiral is forming. When it comes in conjunction with an overbought signal from an oscillator that is an even more powerful sign. The power of the contracting and expanding spiral in that once you get the signal early on before most of the long term move starts.
The use of spiral waves as a validation tool is a bit trickier. Suppose you are planning a buy strategy for a long duration but the Fibonacci lineup points to a contracting spiral; this is a warning sign that you might be taking the wrong direction. On the other hand, if you are planning a buy strategy and the Fibonacci lineup suggests an expanding spiral(bullish) that is already mid-way and started a few waves ago, there is no guarantee that the next wave will signal the end of the trend.
The Bottom Line
Spirals is a very powerful tool for long term trades. As always, it is advised to use spirals alongside an oscillator and other indicators in order to better time your trade. Certainly, if you’re planning a multi-week trade, having spirals in your toolbox is a smart move. However, there is one caveat. As you may have noticed, identifying contracting and expanding spirals is most effective early, when you can identify the start of the spiral. It allows you to figure the direction and the strength because when a spiral starts usually a prolonged move is in the cards. But where spirals fail is that you never know exactly when the spiral will end and for that you must be prepared with other sets of indicators.