
Finding a pair of currencies or commodities that can stand up to the cointegration test on both a short term and long term basis can be quite difficult. It is common for pairings to have some degree of distance or long term deviation away from the linear regression and this can greatly affect performance.
Several high profile market neutral hedge funds have been victim to this regression breakout. Long Term Capital Management (LTCM) is the most famous example. The fund lost several billion dollars in 1998 during the Russian financial crisis. Nearly every position in its bonds and derivative pairings went off the rails all at the same time.
Trading pairs is not full proof and strict risk management and cointegration retraining must be implemented. As discussed in our previous posts on correlation and cointegration, we are looking for the degree to which two variables will return to their common mean. This will determine our entry and exit strategy, and where we will place our stops.
Gold and Silver are identified in previous articles as a good potential trading pair due to its statistically high long term percentage levels.
30 Day Correlation: 94.98%
2 Year Correlation: 26.99%
13 Year Correlation: 95.3%
2 Year Cointegration: 85%
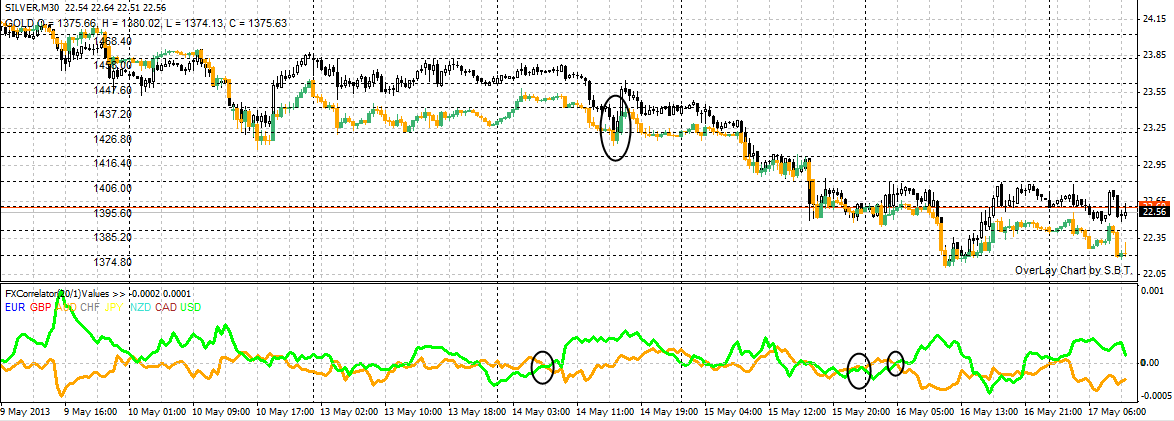
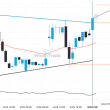
Silver (Black) Gold (Orange Green) 30 Minute Chart
Setting up Charts
Setting up a pairs template in MetaTrader is relatively simple and requires two free indicators (these have been included with the tutorial). The first indicator is that of the FX Correlator and the second is the overlay chart. Highlighted below are the step by step instructions on adding each to your chart.
1. Open Metatrader and Choose Chart
2. Drag the Overlay Chart onto the open chart window, and specify default settings. Click OK.
3. Attach the FX Correlator to the chart, click INPUTS and change all currencies to FALSE except for USD and AUD. The reason why we are keeping these two as TRUE is outlined in the trade setup section. Click OK.
Trade Setup
You will now see two indicators positioned on the chart window. The top overlay chart will highlight the price of silver in comparison to gold. You will notice that the general trend direction is quite similar (correlation), however there are points along the timeline where the prices widen and then regress (cointegration). These are the points that we are looking to profit from.
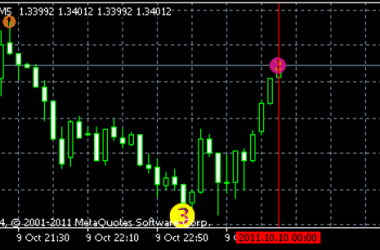
The FX correlator is a unique indicator that calculates a spread between the main chart window and specified other crosses. When we added the indicator to the chart, we only specified the AUD and USD currencies. Hence we can only see two coloured linear regression points along the time line. The reason we chose the Aussie dollar, was because of its susceptibility to commodity prices movements and the US dollar is the natural base cross with Gold and Silver.
Trading Opportunities:
• Long Gold and Short Silver when the USD crosses above the AUD on the FX Correlator.
• Short Gold and Long Silver when the USD crosses below the AUD on the FX Correlator.
In the diagram above, we have circled a number of trade setups. On the 14th of May at 4:00, the USD crossed higher than the AUD, triggering a potential Short Silver/Long Gold scenario. According to the chart, Silver regressed back to the mean and overlapped Gold at 12:00. The second possible trade scenario occured on the 15th of May at 20:00. As the AUD crossed above the USD, a Long Silver / Short Gold trade was triggered with the spread widening.
Risk Management
• Tight Stops on both crosses
• Calculate the correlation and cointegration of Gold and Silver regularly (daily basis). If the cointegration breaks down (below 80%) do not trade.
• Position size should be based on underlying value and may not be equal.