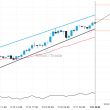
The single most evident quality of range bound is, quite simply, falling volatility or Standard Deviation. As Standard Deviation falls, the pair has smaller fluctuations and therefore is “bound” within a range. Likewise, when Standard Deviation is low we are stuck in a range.
If we can time Standard Deviation (and we can), we can know when it’s about to fall. If it is about to fall then we are heading to a range bound and can adjust our strategy accordingly. Moving Standard Deviation is a measure of the change of Standard Deviation through time. And it is exactly designed for our specific case and thus makes it the ultimate tool to time an upcoming range bound. Here’s how you do that:

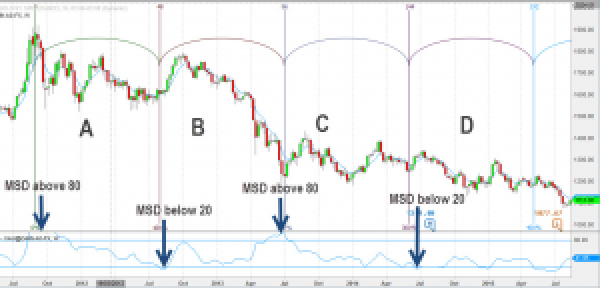
In the chart above, we have the Moving Standard Deviation or MSD running (at the bottom). It is evident that MSD tends to top out after surpassing the 80% level while it tends to bounce back after falling below 20%.
In part A and C, you can clearly see that as MSD topped out above 80% the pair became less volatile and then moved into a range. On the flip side, when MSD moved below 20%, we can expect the range bound to end and the trend to continue.
Validate the Range
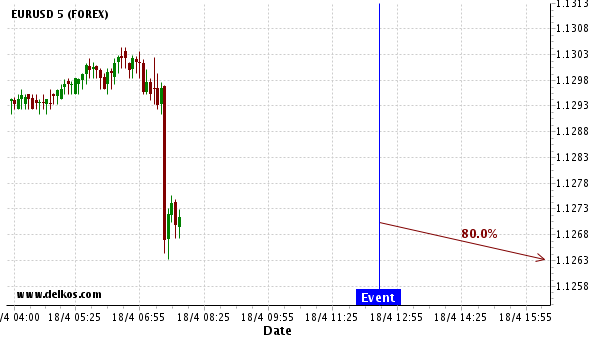
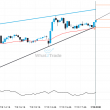
First Validation: If the pair had been surging when the MSD surpassed the 80 level, that’s your high band of the range. On the other end, if the pair had been sliding when the 80 was reached, that’s your low. Whatever high or low was reached during the time the MSD hit above 80 that’s your first confirmation of the range you will be getting.
Second Validation: The confirmation of the other band of the range will present itself as a candle with a needle, rather shortly after.
A Few Rules of Thumb
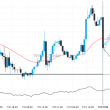
MSD 20 – Exit Immediately: Regardless of direction in your range bound trade (long/short) or time elapsed since the 80 level signaled the range bound, be wary. If the MSD falls below 20 get ready to terminate your trade, because the trend is about to resume and your range might be over. Although it’s not always immediate, it’s better to take precaution rather than lose your gains by ignoring the below 20 signal.
MSD is Only Good for Range: That might sound tricky. As we just stated, the MSD will always fall below 20 before the trend resumes. You’ll know when to exit your range bound trade and be able to cap your risk of loss. But many times MSD will fall below 20 and the trend won’t immediately resume. Thus, don’t use the MSD to predict the opposite of a range bound; that is, to predict the trend. There are different tools for identifying when a trend is about to re-emerge.
Range Bound Cycles: Finally, as you can see in the chart, in the long run the cycles of range bound vs trending tend to be more or less the same length. That is always something to keep in mind. Although the MSD will be your mark to exit/enter the range, timing your cycles of range is always useful to let you know how much more time might be left in that lucrative range bound trend you are taking.