The double top pattern is no doubt among the simplest and most familiar price patterns in technical analysis. Typically, a double top pattern is followed by a sell off. In theory, this rather simple pattern should be easy for traders to pounce on and yet, too often, it’s a cause for frustration. That’s because the realization that a pattern has formed comes too late and, as a result, there’s little room for profit. But before you become discouraged there is an effective strategy – a tactic, if you will – that will allow a trader to recognize a double top and, at least most of the time, ride on the trend reversal, just in time to profit.
Spotting a Double Top
The first part in trading a double top is spotting the double top on time. I like to call it the two-step verification.
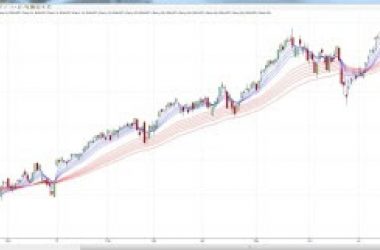
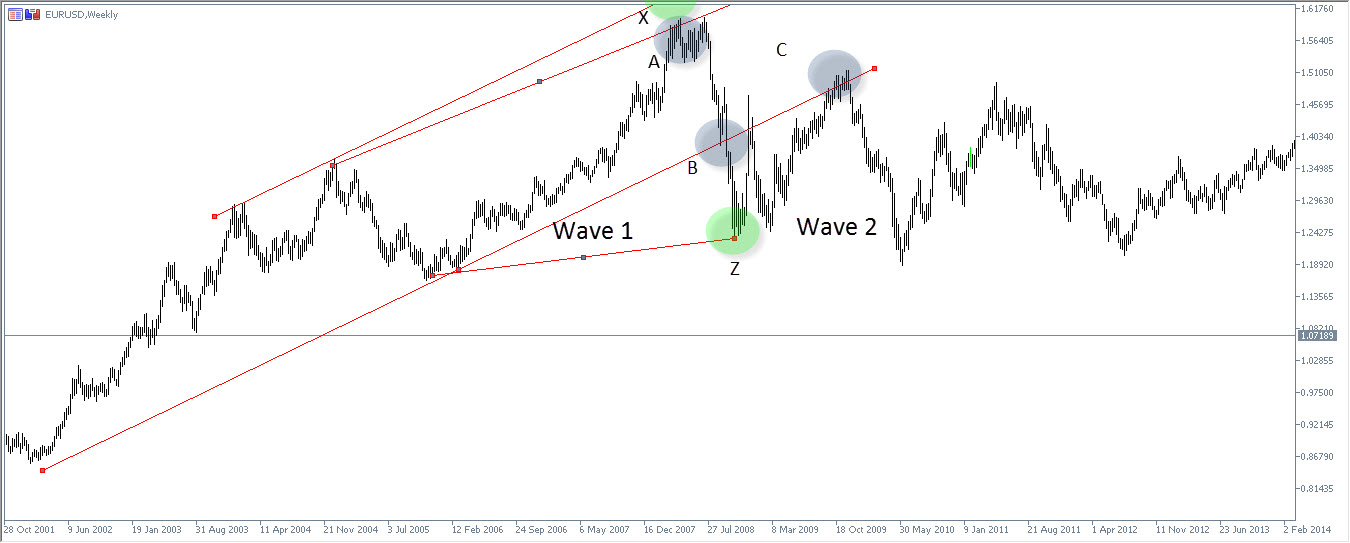
As we can see in the chart below, the second wave has reached a climax in Point A. Seemingly, that is still a bullish sign because Point A is higher than the previous peak. But there is more to the picture than meets the eye. If we stretch a trend line from the previous top we can see that Point A signals some sort of slowdown; it is lower than Point X where the trendline indicates it should be. That is the first confirmation. If the top of the wave is lower than the trendline indicates, it is the first cue that a double top might be forming.
The second sign emerges in Point B, where the wave, rather than ending in the supporting bullish trendline below it, ends much lower. That is our second confirmation.
So why do those two occurrences signify that a double top is coming? Because when the top of the wave is lower than what the trend warrants, it suggests that the price range is shifting lower. Because the wave bounced back at Point Z, it confirmed that a double top is coming and that the price range is shifting lower.
Entry and Stop Loss
After you recognized that the double top is, indeed, coming, the next phase would, of course, be to place your entry and stop loss.
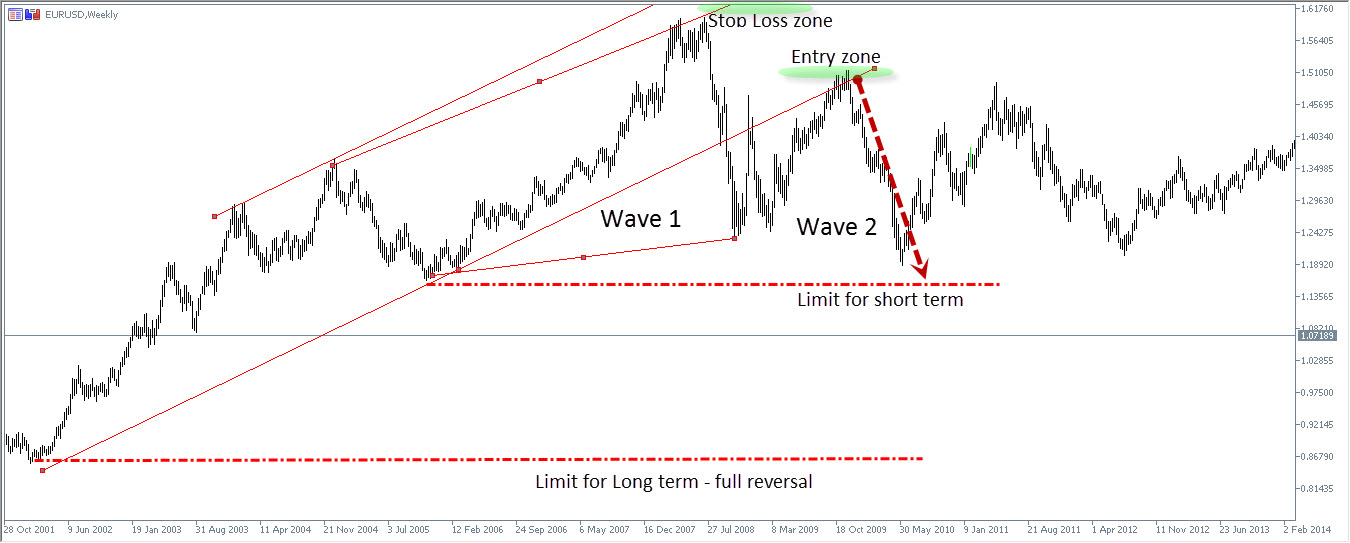
The ideal place to open a short under a double top would be just above the shoulder of the wave that signalled the double top; in the chart below this is wave one. Notice, however, that the actual entry comes at wave number two. This requires discipline; if the following wave does not hit our sell point just above the shoulder of wave number one, we do not enter.
The reason? We want to minimize our stop loss risk. Our stop loss should be placed slightly above the top of wave one; if we enter too early we will be forced to take more risk in our stop loss and we could end up profiting much less.
Setting Your Target
When setting a target for your short the most important aspect to consider is the timeframe you are trading. The longer the timeframe, the higher the likelihood that the double top will lead to a significant sell off. But the shorter the duration, the higher the likelihood that what you are witnessing is part of a correction within a bigger trend.
In the above example, we are witnessing a macro trend that lasted years and thus the likelihood that a major correction will follow this double top is high. Under such a case, the trader might set his target for a full reversal.
There is one noticeable trade off in trading a double top on a long-term trend; at times, there may be several failed (single top) attempts to break higher rather than a single double top before the correction begins. That means that while the potential gain is higher it may take longer to materialize.
Hence, if the double top you are trading belongs to a trend that lasts several days, or even several weeks, the prudent target should be at the lowest point of wave one in the double top. This will usually correspond with the 50% Fibonacci retracement level. Since our entry has been above the shoulder of wave one, it should provide a fair gain potential relative to the risk.
In conclusion, it should be noted that it does not mean that if you’re trading a trend with a shorter time horizon that you cannot expect an utter trend change and a bigger potential. What it does mean is that you are just taking the risk that it might be part of a bigger bullish trend. If that is the case, then your stop loss could be hit before the limit is reached. But once again, this is just a risk you must decide if you are willing to take for a potentially bigger profit.
Of course, as I always like to stress, there is no perfect strategy. It is always advisable to use indications to get some contrast on the trade you are about to take, regardless of the strategy. But if performed with discipline, and considering that a double top pattern is so common, this strategy could come in handy.