Through this column we have covered many oscillators which are generally very effective in analyzing momentum; they include the Average True Range, MACD and the VIDYA. Some oscillators are better at predicting short term momentum, while some are lagging indicators and tend to shine brighter when it comes to long term momentum. Yet, in this article, I will be focusing on one oscillator—the Aroon Indicator—that has a very different benefit. As a backstory, the Aroon Indicator was developed by Dr. Tushar Chande a little more than 20 years ago. What makes the Aroon indicator special is that it provides in-depth insight as to how the buyers and the sellers are behaving within each price level. I will explain how that understanding of the buyers’ and the sellers’ behavior is very useful information.
Aroon Indicator: The Basics
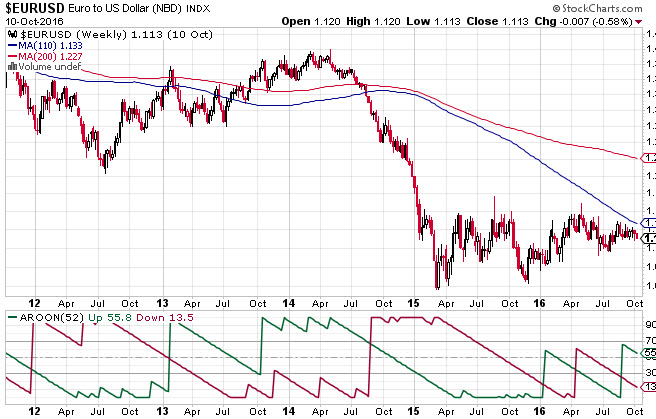
The Aroon indicator, as seen in the chart below, has two separate curves, in this case marked with green and red. The green curve, called the Aroon Up, measures the buying momentum over time and the red curve, called the Aroon Down, measures the selling momentum. How does the Aroon measure momentum? In the Aroon Up it measures how much time it takes a pair to reach the highest level from the opening price at a given period. Conversely, in the Aroon Down, it measures how much time it takes the pair to reach a new low from the opening price.
In both the Aroon Up and the Aroon Down, the higher the indicator the stronger the momentum. So if the Aroon Up is high, it means buying activity is strong, and if the Aroon Down is high it means selling activity is strong. If both are high, then buying and selling activity is high, and if both are low, vice versa.
Aroon Indicator: Down to Practice
Now that we have established how to read the Aroon Up and the Aroon Down, it’s time to move into practice—how comparing the Aroon Up and the Aroon Down within the Aroon Indicator can help us understand the trend.
In the sample below we can see two zones, which I will call Zone A and Zone B. Each chart variation captures a different layer in the Aroon analysis and therefore each could provide a practical example on how to use the Aroon Indicator.
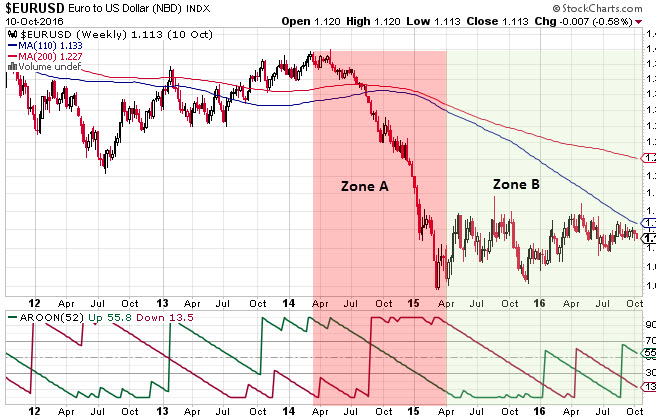
Zone A.
In Zone A, we can see that, around July(Point X) the EURUSD had just started a very strong bearish trend that subsided only in April 2015. Before the Bearish trend began, the Aroon Up was high and the Aroon Down was low. This indicates that buying activity was elevated while selling activity was low. Then in April, the Aroon Up was starting to fall and the Aroon Down jumped shortly after. What does it mean? It means a quick change of momentum because as soon as the buyers became exhausted the sellers immediately began piling in. Selling activity was high through to April 2015 while buying activity continued to fall.
Insights-
- The sellers are substantially more dominant around Point X. The sellers were very quick to react, showing overwhelming conviction over the buyers around this point. Hence, it should be recognized by the trader as a substantial pivot.
- Once the Aroon Down jumped it stayed at an elevated level and held almost a straight line, suggesting the selling momentum was especially strong and this means a trader could expect a strong bearish move.
Zone B.
In Zone B, we can see something interesting; while the Aroon Down fell until October 16th, the Aroon Up was still staying low. So, while the sellers were out of the market, the buyers were not coming in, suggesting very weak buying appetite. Moreover, after October 16th, the Aroon Up jumped and so did the Aroon Down; later, both fell and then both jumped again. That suggests that even after the nose dive the pair took, and even after some buyers came back, the buyers were hesitant to buy. Nevertheless, because the Aroon Down is also unstable it means that, at that level, the sellers were also somewhat hesitant.
Insights-
- In the immediate time frame, the trader might expect the pair to trade with some sort of sideways momentum, with both the buyers and the sellers undecided.
- When we look at the bigger picture and in the context of what happened before October 16th it is clear that the sellers had the upper hand. And, even when the sellers were sitting on the fence, the buyers did not come in and even when they did they were still hesitant. This means that there is a rather high likelihood that the sellers will gradually comeback for more and that signals a high likelihood of another bearish wave once the sideways movement is over.
The Bottom Line
Of course, I always like to stress that no single indicator is perfect and the Aroon Indicator is no different in that respect. If the Aroon Indicator is not calibrated to the right duration or at other times during very high volatility the reliability of it might be lower. But, this is a very powerful Indicator, and the fact that it adds another layer to our analysis by letting us understand the behavior of both the buyers and the seller around each time frame and price zone makes it a powerful tool for those traders that focus on the long term.