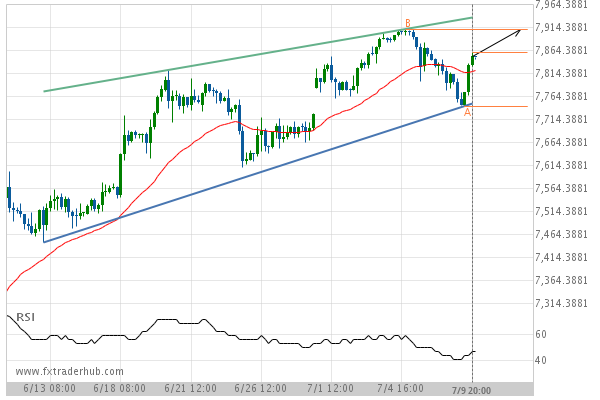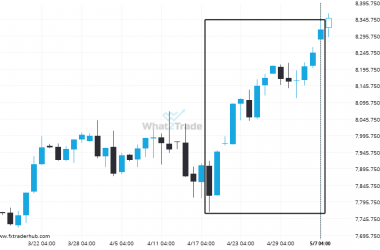
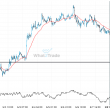
NAS100 is heading towards the resistance line of a Rising Wedge. If this movement continues, we expect the price of NAS100 to test 7909.7500 within the next 7 days. But don’t be so quick to trade, it has tested this line numerous times in the past, so this movement could be short-lived and end up rebounding just like it did in the past.
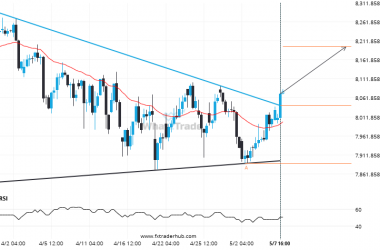
NAS100 is quickly approaching the resistance line of a Rising Wedge. We expect either a breakout through this line or a rebound.