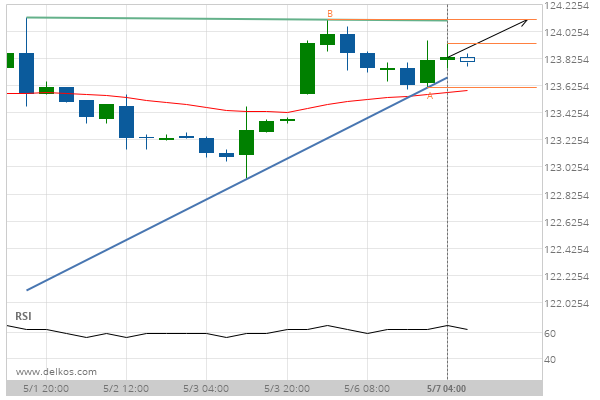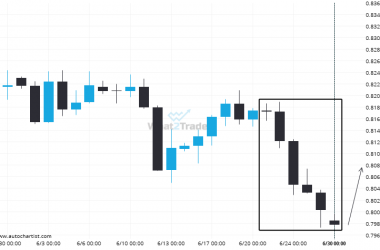
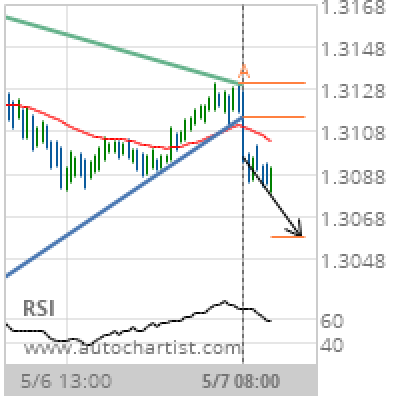

Triangle has broken through the support line at 07-May-2019 08:00 UTC. Possible bearish price movement forecast for the next 11 hours towards 1.3058. Supported by Downward sloping Moving Average
Chart 30 Minutes
Pattern Triangle
Length 86 Candles
Identified 07-May-2019 08:00 UTC