Receive the latest alerts via email

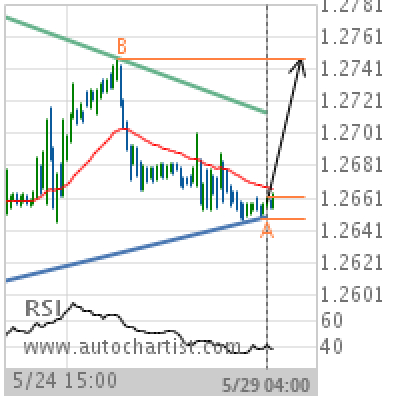
GBP/USD Target Level: 1.2748

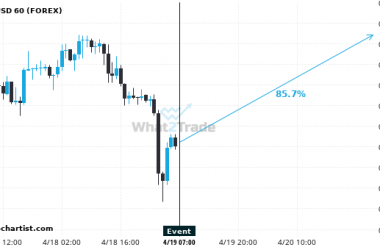
Triangle identified at 29-May-2019 04:00 UTC. This pattern is still in the process of forming. Possible bullish price movement towards the resistance 1.2748 within the next 2 days. Supported by RSI below 40 Chart 1 hourPattern TriangleLength 133 CandlesIdentified 29-May-2019 04:00 UTC
GBP/USD Target Level: 1.2748

Triangle identified at 29-May-2019 04:00 UTC. This pattern is still in the process of forming. Possible bullish price movement towards the resistance 1.2748 within the next 2 days. Supported by RSI below 40

Chart 1 hour
Pattern Triangle
Length 133 Candles
Identified 29-May-2019 04:00 UTC

Total
0
Shares
Previous Post

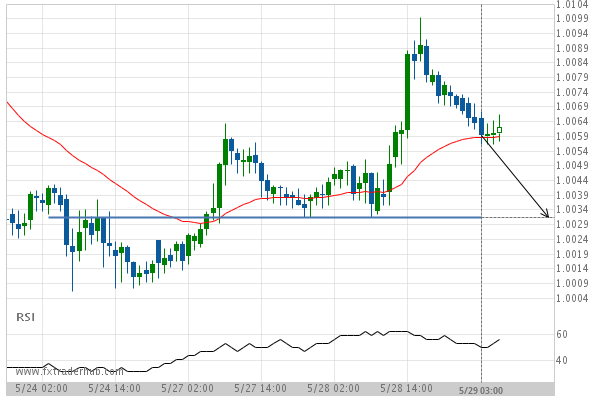
USD/CHF is approaching the support line of a Support. It has touched this line numerous times in the last 6 days.

Next Post

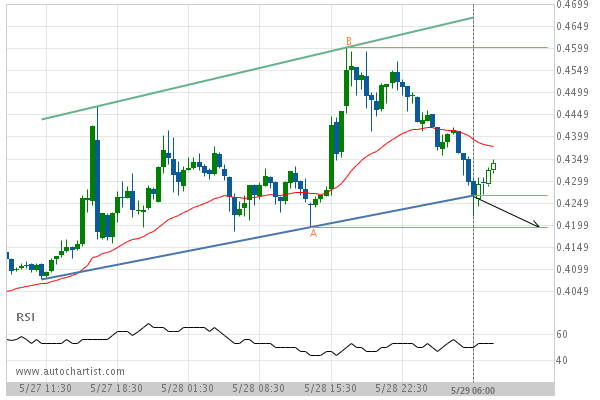
Big movement expected on XRPUSD after a breach of the support

Related Posts