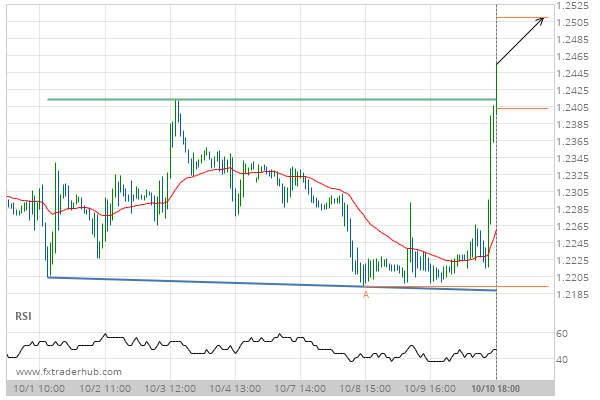
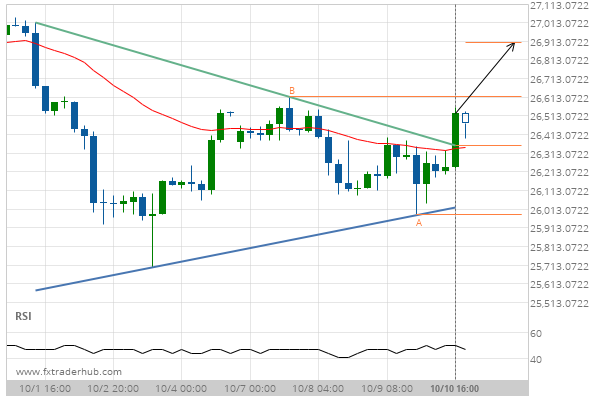
GBP/USD has broken through the resistance line of a Double Bottom technical chart pattern. Because we have seen it retrace from this position in the past, one should wait for confirmation of the breakout before trading. It has touched this line twice in the last 10 days and suggests a target line to be around 1.2509 within the next 3 days.
Related Posts
A possible move on AUDCAD as it heads towards resistance
AUDCAD was identified at around 0.895865 having recently rebounded of the support on the 4 hour data interval.…
Will AUDJPY break through the support level it tested before?
AUDJPY is en route to a very important line that will be a definite deciding factor of what…
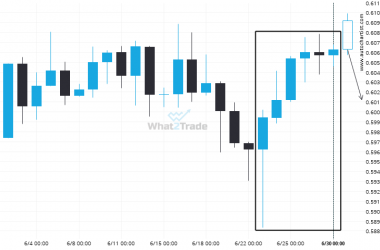
NZDUSD experienced 5 consecutive daily bullish candles to reach a price of 0.6062
After posting 5 consecutive bullish candles in 8 days, you may start considering where NZDUSD is heading next,…

