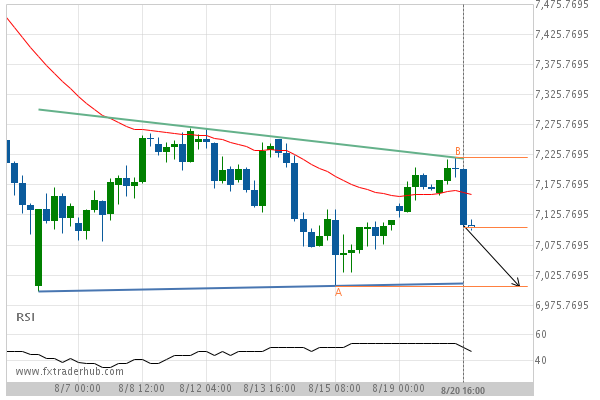
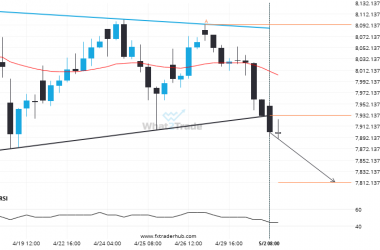
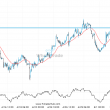
UK100 is moving towards the support line of a Descending Triangle which it has tested numerous times in the past. We have seen it retrace from this line before, so at this stage it isn’t clear whether it will breach this line or rebound as it did before. If UK100 continues in its current trajectory, we can expect it to reach 7007.5000 within the next 3 days.
Related Posts
NAS100 broke through a resistance at 2024-05-02T19:00:00.000Z, with the price momentum continuing to move in an upward direction over the next hours, good opportunity presents itself with the price expected to reach 17707.6292.
NAS100 has broken through a resistance line of a Falling Wedge chart pattern. If this breakout holds true,…
Important price line breached by UK100. This price has been tested numerous times before.
UK100 has broken through a line of 8175.0000 and suggests a possible movement to 8203.5996 within the next…
FRA40 breakout from a Triangle trade setup. Will it continue this trend to hit the target price?
The last 15 4 hour candles on FRA40 formed a Triangle pattern and broken out through the pattern…