

Day: November 20, 2019
23 messages
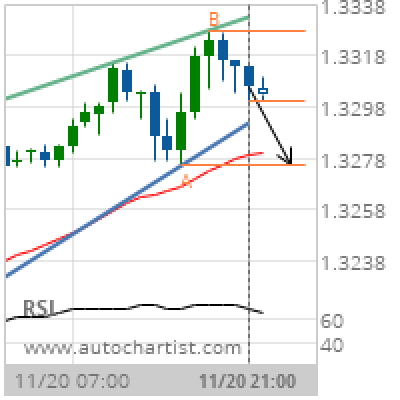
USD/CAD Target Level: 1.3275
Rising Wedge identified at 20-Nov-2019 21:00 UTC. This pattern is still in the process of forming. Possible bearish price movement towards the support 1.3275 within the next 9 hours. Supported by RSI above 60 Chart 1 hourPattern Rising WedgeLength 31 CandlesIdentified 20-Nov-2019 21:00 UTC
Big movement expected on Soybeans JANUARY 2020 after a breach of the support
Soybeans JANUARY 2020 has broken through a support line of a Descending Triangle and suggests a possible movement…
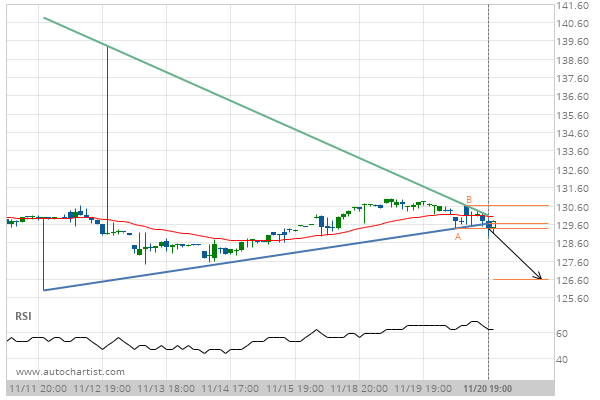
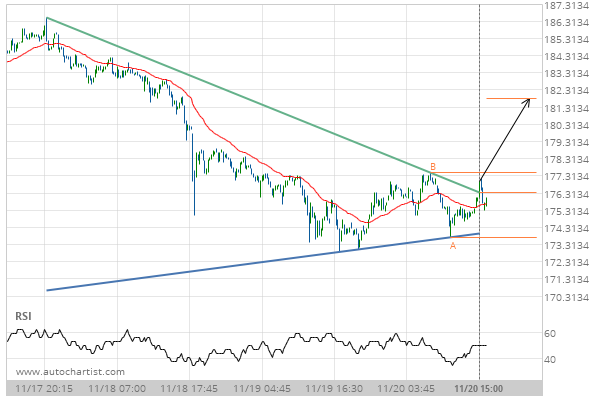
Big movement expected on Jpmorgan Chase & Co. after a breach of the support
Jpmorgan Chase & Co. has broken through a support line of a Triangle and suggests a possible movement…
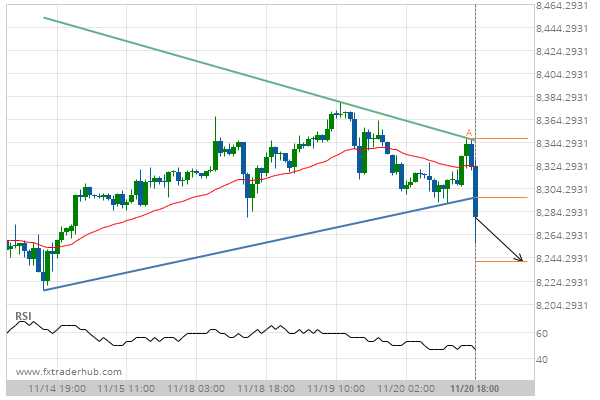
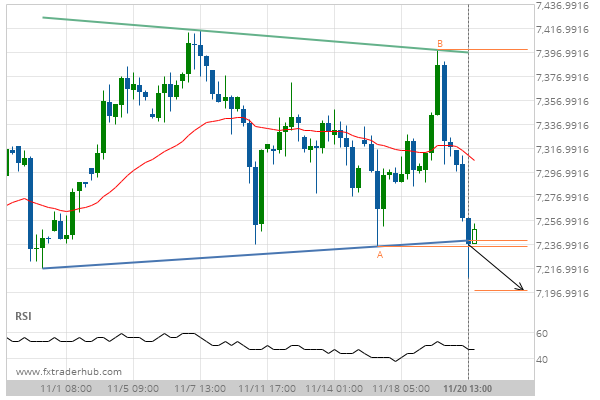
Breach of support could mean a start of a bearish trend on NAS100
NAS100 has broken through a support line of a Triangle chart pattern. If this breakout holds true, we…
Breach of resistance could mean a start of a bullish trend on Wheat DECEMBER 2019
Wheat DECEMBER 2019 has broken through a resistance line of a Channel Down chart pattern. If this breakout…
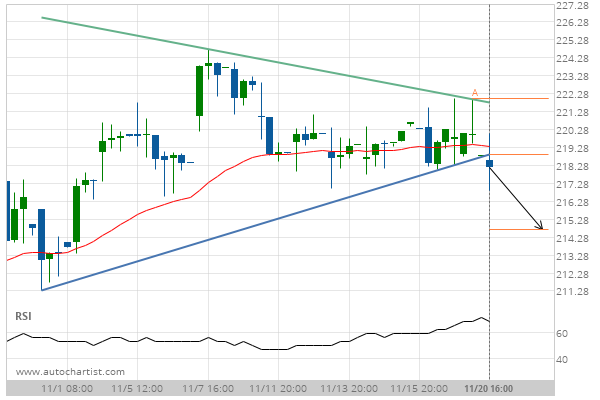
Big movement expected on Goldman Sachs Group Inc. after a breach of the support
Goldman Sachs Group Inc. has broken through a support line of a Triangle and suggests a possible movement…
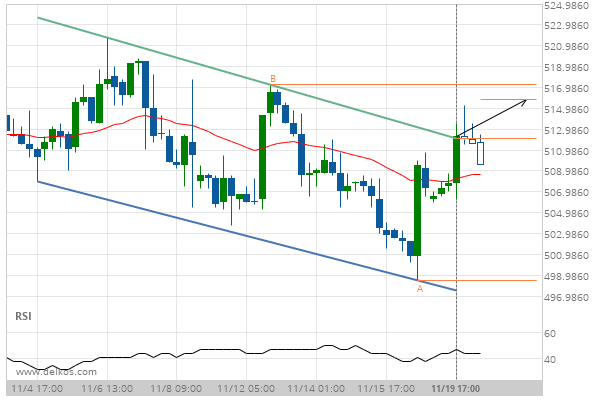
Breach of resistance could mean a start of a bullish trend on ETHUSD
ETHUSD has broken through a resistance line of a Triangle chart pattern. If this breakout holds true, we…
Breach of support could mean a start of a bearish trend on UK100
UK100 has broken through a support line of a Triangle chart pattern. If this breakout holds true, we…
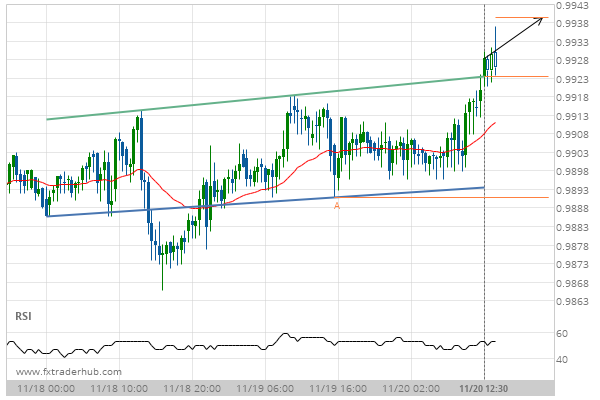
After testing resistance twice in the past, USD/CHF has finally broken through. Can we expect a bullish trend to follow?
The breakout of USD/CHF through the resistance line of a Inverse Head and Shoulders could be a sign…
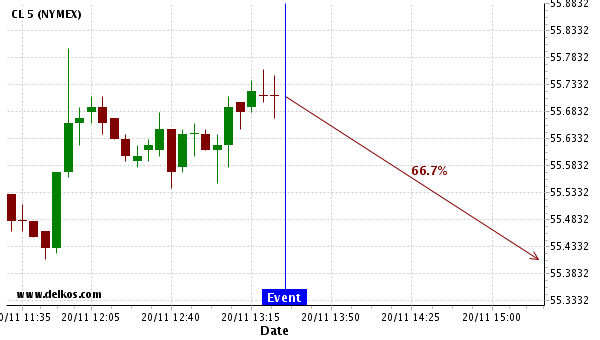
We expect CL to trend downwards right now.
Based on the last 12 Inflation Rate YoY events in Canada, we expect CL to trend downwards right…