
Day: May 21, 2019
22 messages
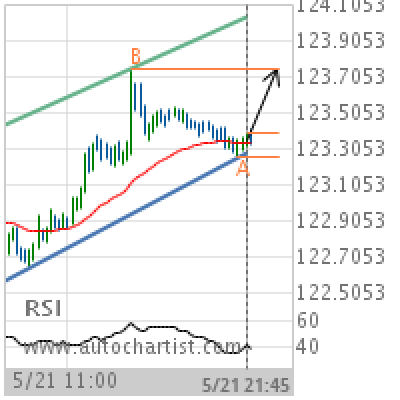
EUR/JPY Target Level: 123.7480
Channel Up identified at 21-May-2019 21:45 UTC. This pattern is still in the process of forming. Possible bullish price movement towards the resistance 123.7480 within the next 8 hours. Supported by RSI below 40 Chart 15 MinutesPattern Channel UpLength 98 CandlesIdentified 21-May-2019 21:45 UTC
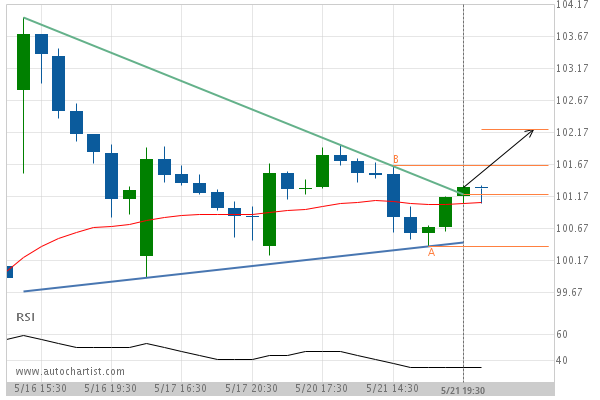
After testing the resistance line numerous times, FRA40 is once again approaching this line. Can we expect a bullish trend to follow?
The movement of FRA40 towards the resistance line of a Triangle is yet another test of the line…
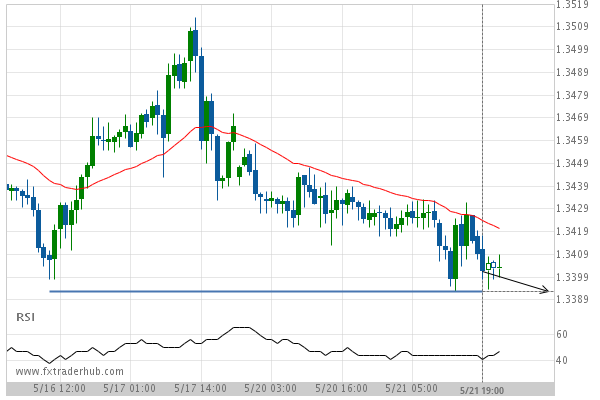
USD/CAD is quickly approaching 1.3393. We expect either a breakout through this line, or a rebound.
USD/CAD is heading towards a line of 1.3393. If this movement continues, we expect the price of USD/CAD…
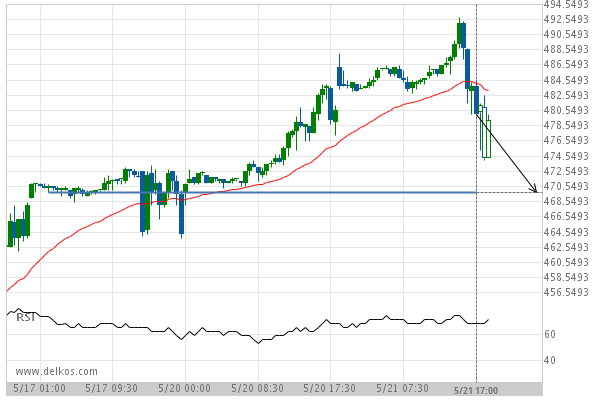
After testing 469.7500 numerous times, Wheat JULY 2019 is once again approaching this price point. Can we expect a bearish trend to follow?
The movement of Wheat JULY 2019 towards 469.7500 price line is yet another test of the line it…
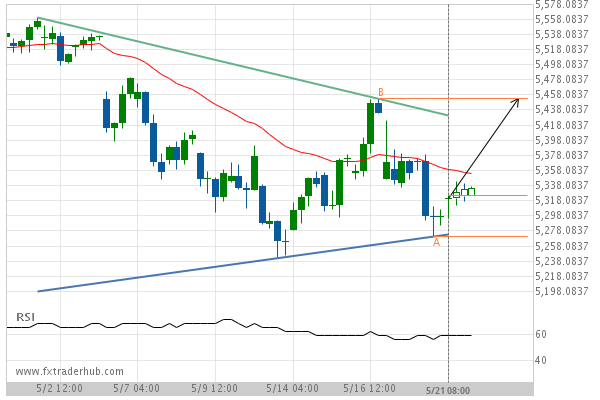
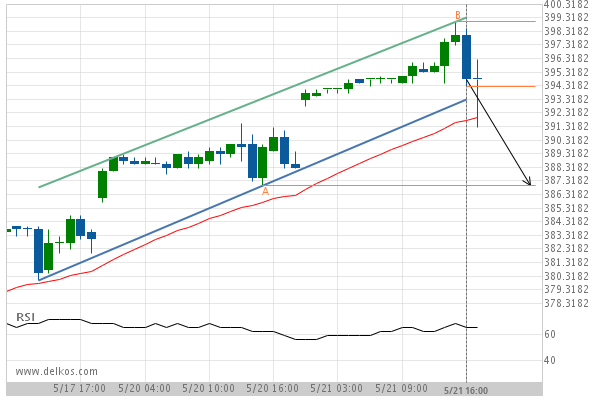
After testing resistance twice in the past, Wal-Mart Stores has finally broken through. Can we expect a bullish trend to follow?
The breakout of Wal-Mart Stores through the resistance line of a Triangle could be a sign of the…
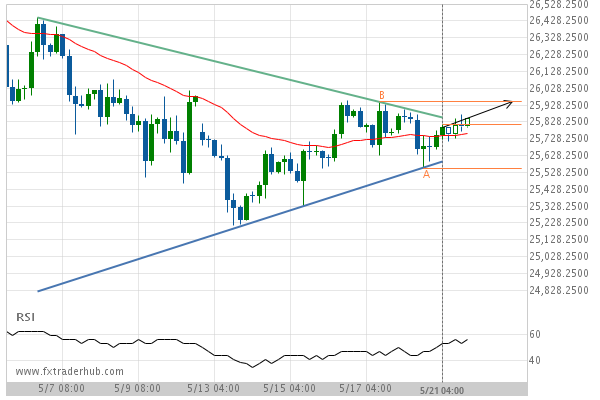
US30 is quickly approaching the resistance line of a Triangle. We expect either a breakout through this line or a rebound.
US30 is heading towards the resistance line of a Triangle. If this movement continues, we expect the price…
Important support line being approached by CORN JULY 2019. This price has been tested numerous time in the last 5 days
CORN JULY 2019 is moving towards the support line of a Channel Up which it has tested numerous…
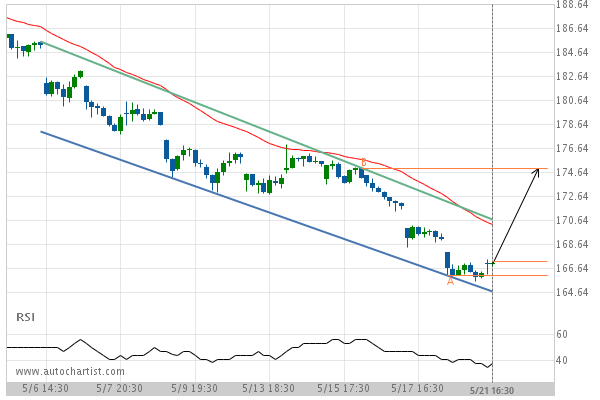
3m Co. is quickly approaching the resistance line of a Channel Down. We expect either a breakout through this line or a rebound.
3m Co. is heading towards the resistance line of a Channel Down. If this movement continues, we expect…

Could a large bullish move on XRPBTC be a sign of things to come?
XRPBTC has experienced an exceptionally large movement higher by 12.27% from 0 to 0 in the last 9…
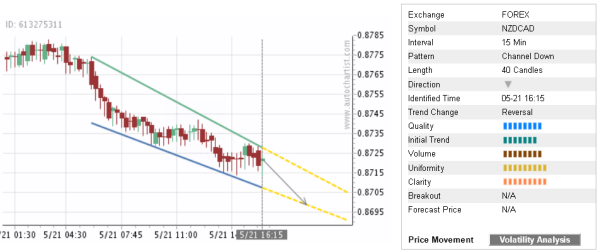
Trade of the Day: NZD/CAD
By: Dima Chernovolov NZD/CAD continues to fall inside the well-formed Down Channel chart pattern which was previously identified by Autochartist on the 15-minute charts. Autochartist measures the quality of this Down Channel at the 8-bar level – which is the result of the strong Initial Trend (7 bars), near-maximum Uniformity and Clarity (9 bars). NZD/CAD…