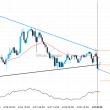
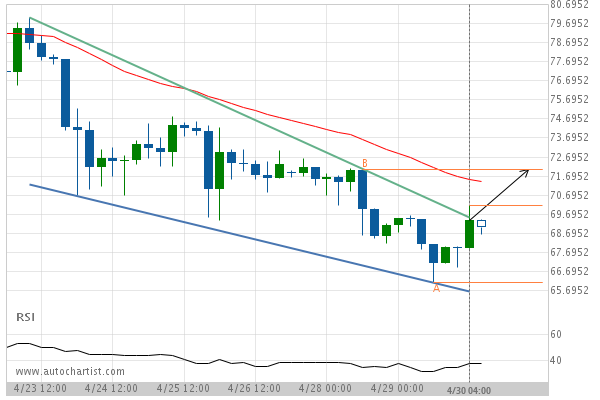
Falling Wedge identified at 30-Apr-2019 04:00 UTC. This pattern is still in the process of forming. Possible bullish price movement towards the resistance 72.0600 within the next 2 days.
ARTÍCULOS RELACIONADOS
Breach of 0.0000 could mean a start of a bearish trend on XRPBTC
The breakout of XRPBTC through the 0.0000 price line is a breach of an important psychological price that…
LTCUSD broke through a support at 2024-04-29T05:00:00.000Z, with the price momentum continuing to move in an downward direction over the next hours, good opportunity presents itself with the price expected to reach 81.6669.
LTCUSD moved through the support line of a Triangle at 83.68569892473118 on the 1 hour chart. This line…
An unexpected large move has occurred on ETHUSD 1 hour chart! Is this a sign of something new? What can we expect?
ETHUSD has moved higher by 6.19% from 3117.95 to 3310.9 in the last 21 hours.