


Browsing Category
Futures
10959 posts

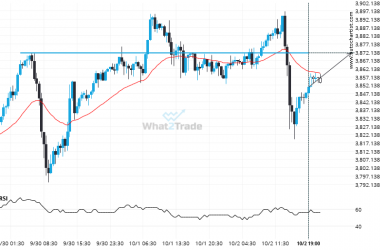
Gold Spot experienced a very large 48 days bullish move to 3909.648.
Gold Spot reached 3909.648 after a 16.81% move spanning 48 days.

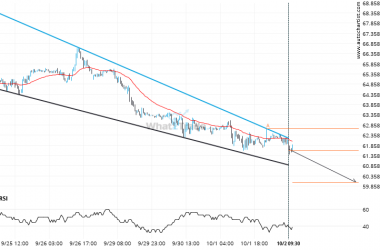
Brent Crude through 65.85670422535212. Is this a confirming a breakout? Will it continue its path in the current trend toward 67.7624?
Triangle pattern identified on Brent Crude has broken through a resistance level with the price momentum continuing to…

Will US Oil break through the resistance level it tested before?
US Oil is moving towards a key resistance level at 62.0110. This is a previously tested level for…
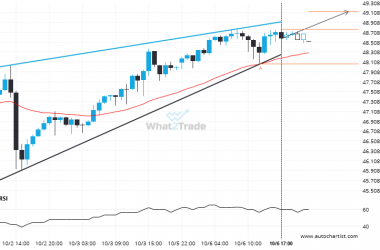
Silver Spot is signaling a possible trend reversal on the intraday charts with price not breaching support.
Silver Spot was identified at around 48.76785 having recently rebounded of the support on the 1 hour data…
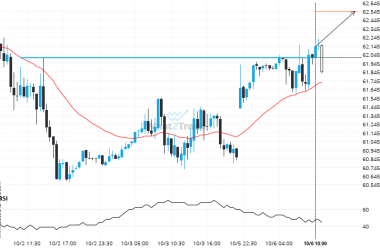
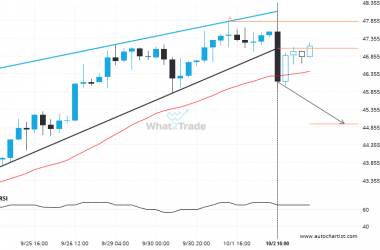
Important price line breached by US Oil. This price has been tested numerous times before.
US Oil has broken through a resistance line. Because we have seen it retrace from this price in…
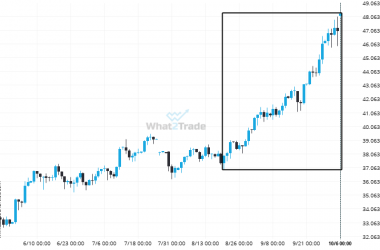
A very large move was recorded on Silver Spot. The size of the shift is exceptional.
Silver Spot just posted a 27.23% move over the past 48 days – a move that won’t go…
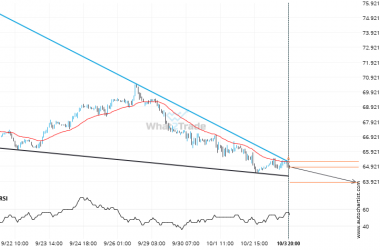
Brent Crude formed a Falling Wedge on the 1 hour chart. Retest of support in sight.
Emerging Falling Wedge detected on Brent Crude – the pattern is an emerging one and has not yet…
Breach of support could mean a start of a bearish trend on Silver Spot
This trade setup on Silver Spot is formed by a period of consolidation; a period in which the…
Gold Spot seems to be on its way to resistance – a possible opportunity?
Gold Spot is approaching a resistance line at 3871.7600. If it hits the resistance line, it may break…
Important support line being approached by US Oil. This price has been tested numerous time in the last 8 days
An emerging Falling Wedge has been detected on US Oil on the 30 Minutes chart. There is a…