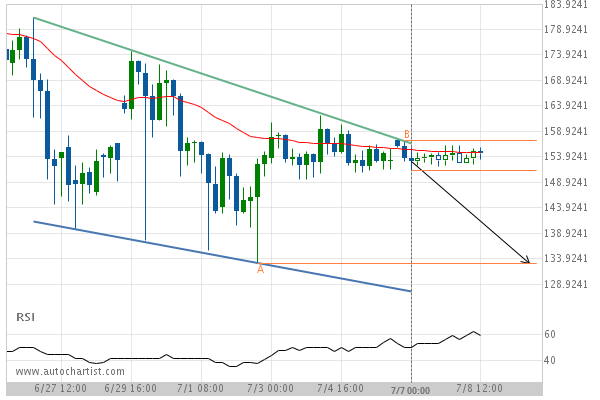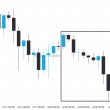


The movement of LTCCAD towards the support line of a Falling Wedge is yet another test of the line it reached numerous times in the past. We expect this line test to happen in the next 2 days, but it is uncertain whether it will result in a breakout through this line, or simply rebound back to current levels.
After testing the support line numerous times, LTCCAD is once again approaching this line. Can we expect a bearish trend to follow?