


Day: November 27, 2019
22 posts
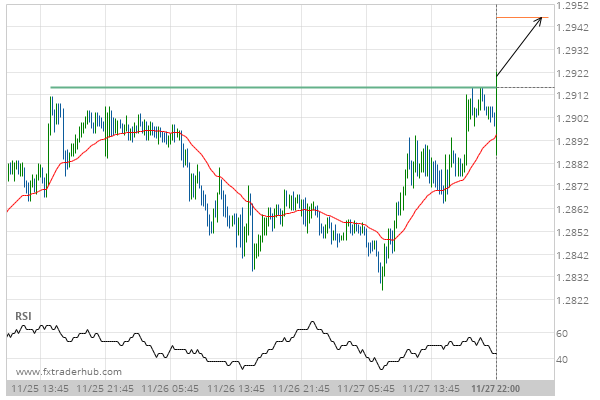
Important price line breached by GBP/USD. This price has been tested numerous times before.
GBP/USD has broken through a line of 1.2915 which it has tested numerous times in the past. We…
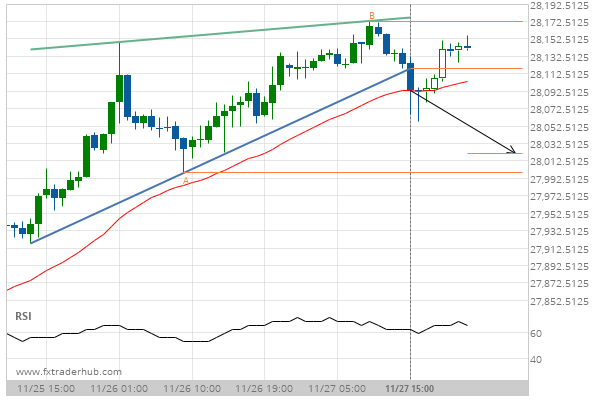
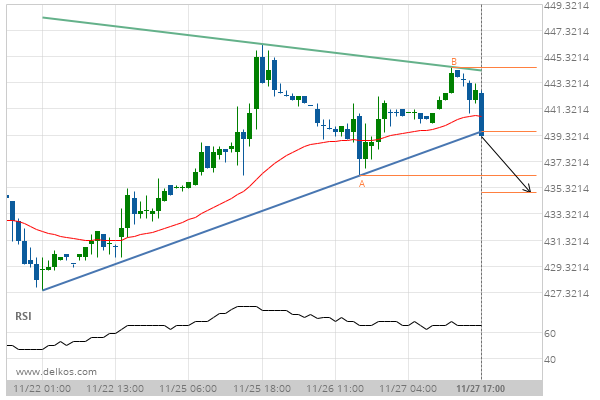
US30 has broken through support of a Rising Wedge. It has touched this line at least twice in the last 3 days.
US30 has broken through the support line of a Rising Wedge. It has touched this line at least…
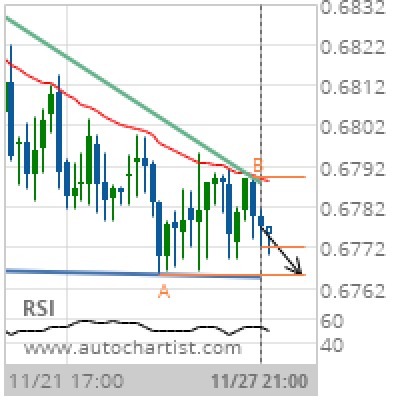
AUD/USD Target Level: 0.6765
Descending Triangle identified at 27-Nov-2019 21:00 UTC. This pattern is still in the process of forming. Possible bearish price movement towards the support 0.6765 within the next 3 days. Supported by Downward sloping Moving Average Chart 4 hourPattern Descending TriangleLength 57 CandlesIdentified 27-Nov-2019 21:00 UTC
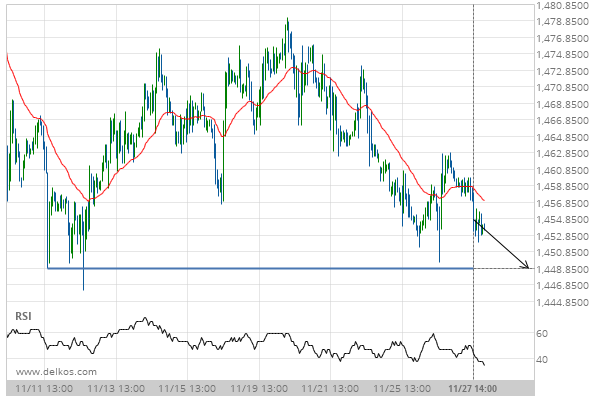
Gold DECEMBER 2019 – approaching a price line that has been previously tested numerous times in the past
Gold DECEMBER 2019 is moving towards the support line of a Support. Because we have seen it retrace…
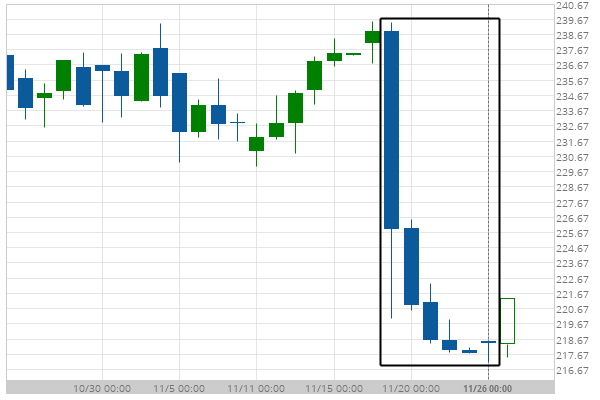
Home Depot Inc. hits 218.4 after a 8.66% move spanning 8 days
For those of you that don’t believe in trends, this may be an opportunity to take advantage of…
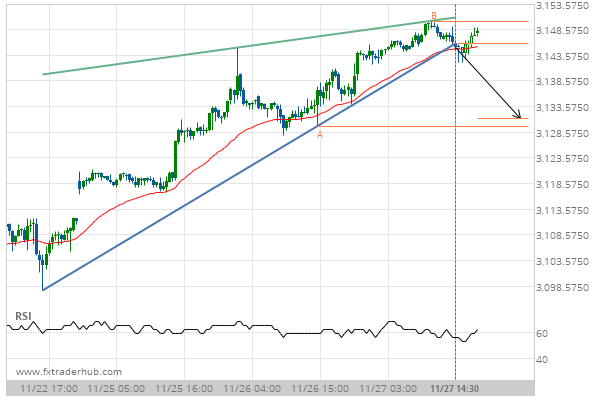
Breach of support could mean a start of a bearish trend on SPX500
SPX500 has broken through a support line of a Rising Wedge chart pattern. If this breakout holds true,…
After testing support twice in the past, KC HRW Wheat MARCH 2020 has finally broken through. Can we expect a bearish trend to follow?
The breakout of KC HRW Wheat MARCH 2020 through the support line of a Triangle could be a…

Breach of resistance could mean a start of a bullish trend on 3m Co.
3m Co. has broken through a resistance line of a Inverse Head and Shoulders chart pattern. If this…
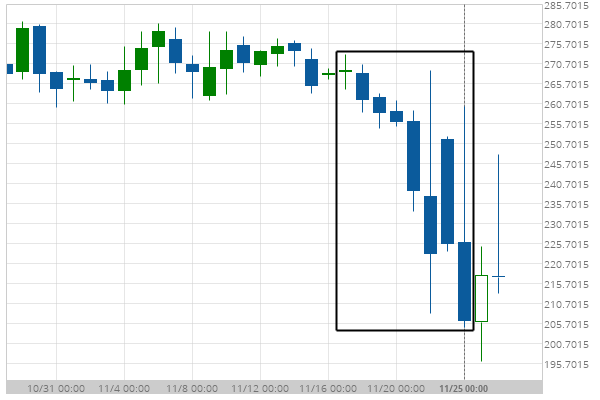
ETHAUD experienced a very large 9 days bearish move to 207.36
ETHAUD has moved lower by 22.81% from 268.63 to 207.36 in the last 9 days.
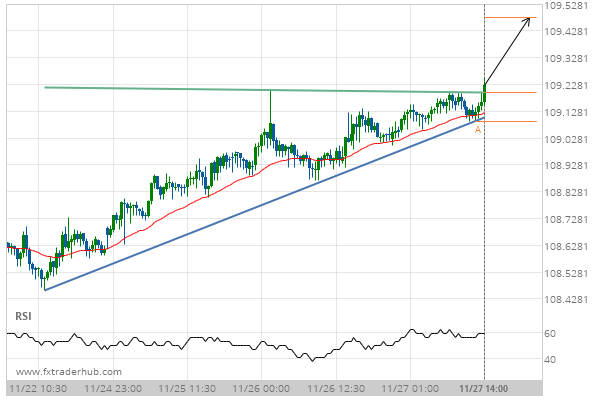
Breach of resistance could mean a start of a bullish trend on USD/JPY
USD/JPY has broken through a resistance line of a Ascending Triangle chart pattern. If this breakout holds true,…