How many times you have seen an FX pair, or any other instrument for that matter, start moving opposite to the trend? Did you wonder was it a mere correction or were you perhaps witnessing a change in trend? Your conclusion will have an acute impact on how you choose your next trade and thus your profit or loss.
Of course, it’s impossible to be 100% certain. But here are three simple methods that could help you decide which could dramatically improve your odds of being right.
Correction zone
The first method to identify a correction or a change in trend is one I like to call the “zone method.” The idea behind it is rather simple.
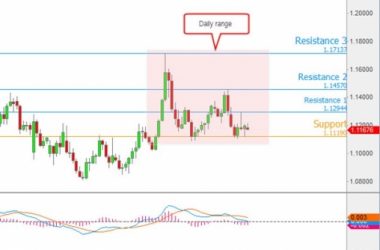
When a support line has also been a resistance line it’s no longer just support and resistance. Rather, it is a border trimming between two separate zones. One is a zone where the pair is bullish and likely to move higher. The other is a zone where the pair is bearish and likely to move lower.
If that zone hasn’t changed, then it’s a temporary correction. If the zone has changed, then it’s a change in trend. From the EURUSD chart below you can see when the 1.168 was broken back in 2014, the pair moved into a bearish zone. If the EURUSD had rebounded back to the bullish zone, then that would mean the trend had changed to bullish.

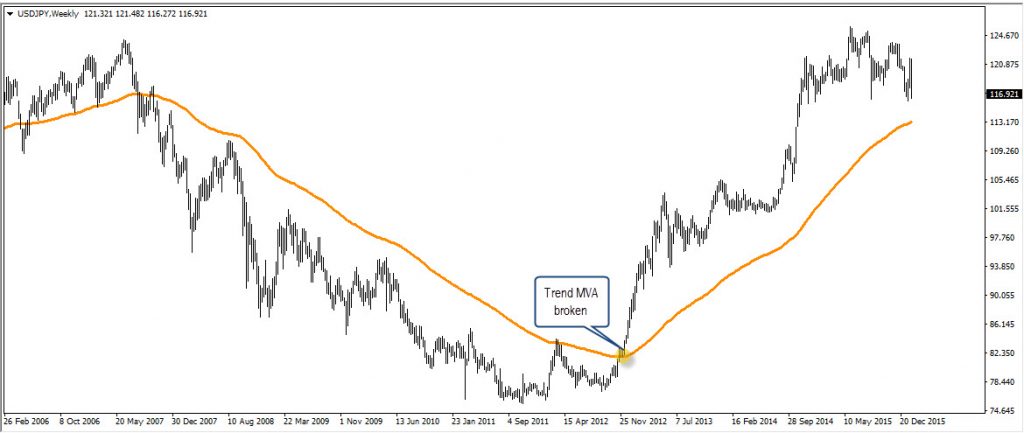
The Trend Average
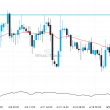
The second method that is useful in gauging a correction or trend change is done by running a moving average. The trick here is to play with the average period until it captures nearly all the trend. You can also switch between an exponential moving average and a simple moving average. Sometimes, an exponential captures the trend better and other times, a simple moving average is all you need. The idea here is to tweak, or fine tune, if you will. In our case, the trend has to be below the average.
Once you have done that, you need to see how the current correction stakes up against the rest. If the latest correction is below the average then it’s a mere correction. If the average is broken, the trend has changed, just as can be seen in the chart below.
Notice that this method is usually effective where the trend is on a rather linear path. It might work on more volatile trends but it will not always be effective.
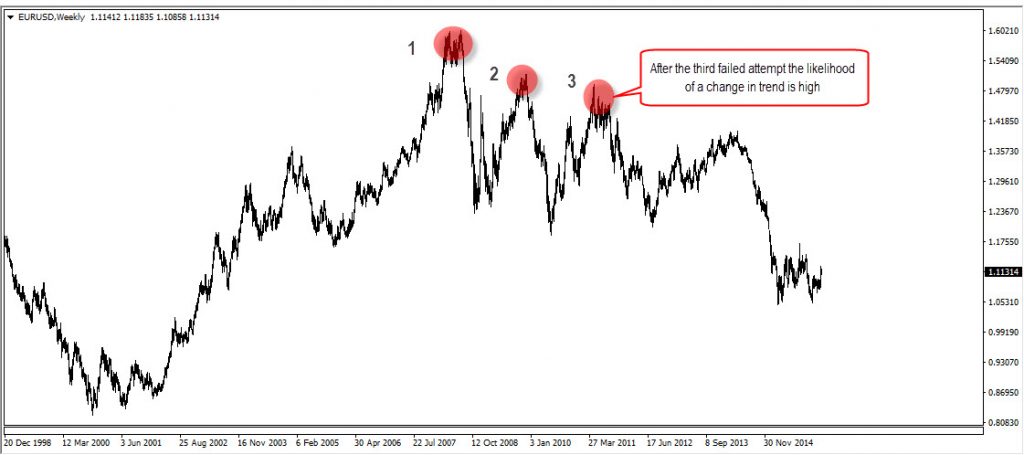
Failed Record
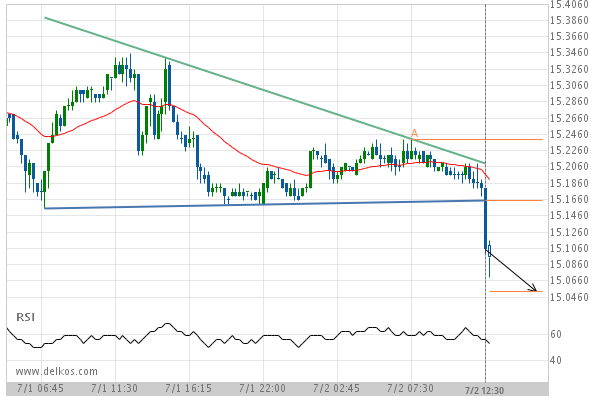
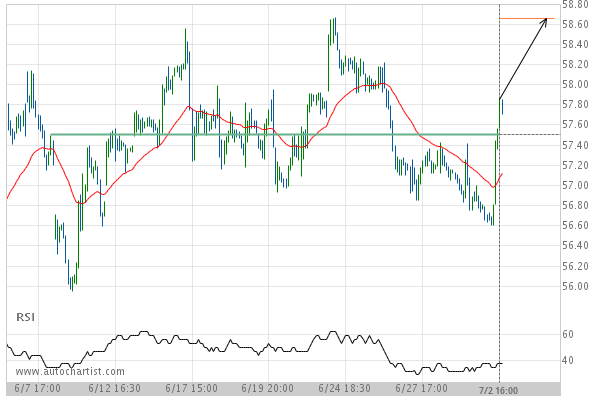
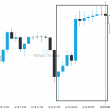
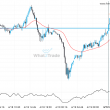
The last of the simple signals is actually more a matter of probability than a proper signal. And it’s actually the simplest to identify. Simply put it is when a pair fails to break a record and it doesn’t matter if it’s a record high or record low.
Usually, three is the lucky charm. Say the pair fails to break a record on the third attempt, as in the examples below. Then, there’s a higher likelihood that this is more than a mere correction. When a record high or record low is involved, there’s a much higher likelihood that this is not a mere correction but a change in trend.
In Conclusion
As you may expect, there are many more methods to differentiate between a correction and a change in trend. Some are more advanced and complicated. Others, like Fibonacci retracement which often times is used incorrectly, tend to be misleading.
While the methods above are far from perfect, the average trader might find that they are simple and easy to implement. They could, therefore, serve him well as he tries to determine if the pair is in correction mode or an actual change in trend.