
Browsing Category
Uncategorized
616 posts
Trade of the Day: NZD/CHF
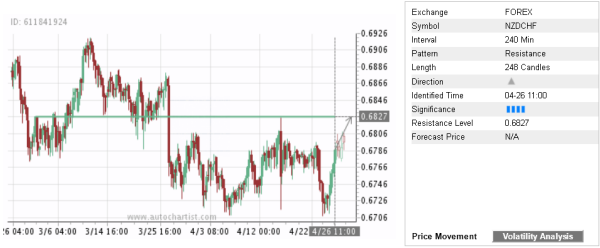
By: Dima Chernovolov NZD/CHF continues to rise in the direction of the 4-hour Key Resistance Level 0.6827 which was recently identified by Autochartist. Autochartist rates the quality of daily this Resistance Level at the 4-bar level – which is the result of the 4 previous reversals from this price level. NZD/CHF is expected to rise…
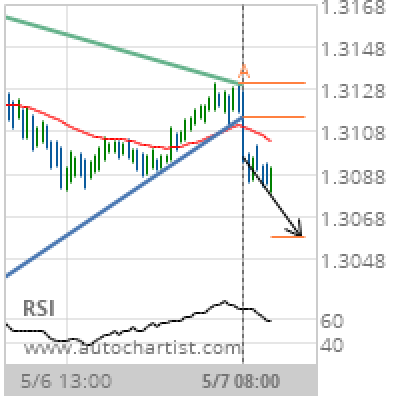
GBP/USD Target Level: 1.3058
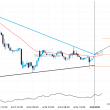
Triangle has broken through the support line at 07-May-2019 08:00 UTC. Possible bearish price movement forecast for the next 11 hours towards 1.3058. Supported by Downward sloping Moving Average Chart 30 MinutesPattern TriangleLength 86 CandlesIdentified 07-May-2019 08:00 UTC
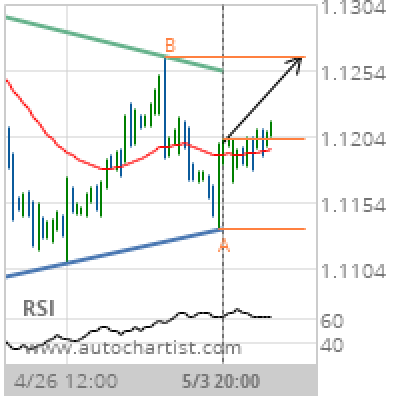
EUR/USD Target Level: 1.1264
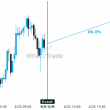
Triangle identified at 03-May-2019 20:00 UTC. This pattern is still in the process of forming. Possible bullish price movement towards the resistance 1.1264 within the next 17 hours. Supported by Upward sloping Moving Average Chart 4 hourPattern TriangleLength 77 CandlesIdentified 03-May-2019 20:00 UTC
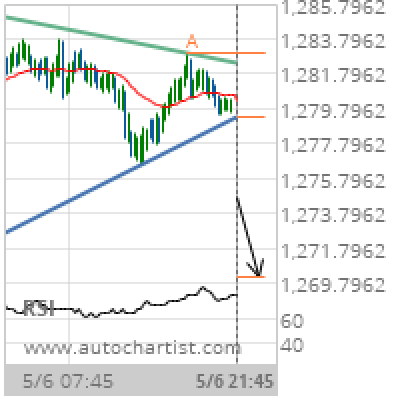
XAU/USD Target Level: 1270.1791
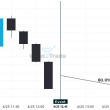
Triangle has broken through the support line at 06-May-2019 21:45 UTC. Possible bearish price movement forecast for the next 11 hours towards 1270.1791. Supported by RSI above 60 Chart 15 MinutesPattern TriangleLength 127 CandlesIdentified 06-May-2019 21:45 UTC
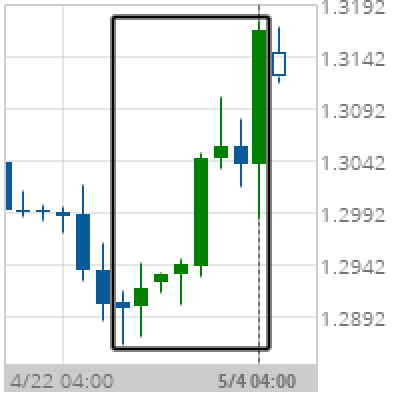
Big Movement GBP/USD
GBP/USD experienced a 2.02% bullish movement in the last 9 days. Chart DailyPattern Big MovementLength 8 CandlesIdentified 04-May-2019 04:00 UTC
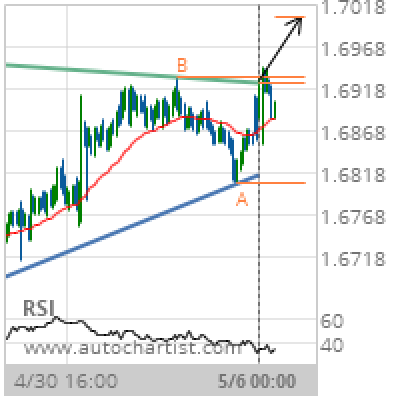
EUR/NZD Target Level: 1.7003
Triangle has broken through the resistance line at 06-May-2019 00:00 UTC. Possible bullish price movement forecast for the next 2 days towards 1.7003. Supported by RSI below 40 Chart 1 hourPattern TriangleLength 177 CandlesIdentified 06-May-2019 00:00 UTC
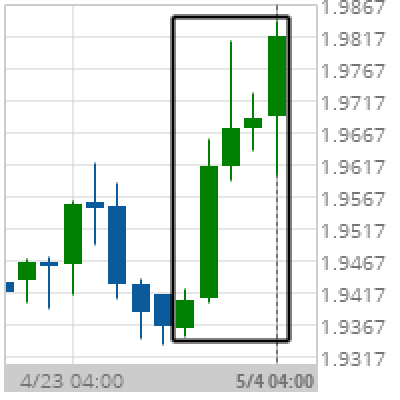
Big Movement GBP/NZD
GBP/NZD experienced a 2.35% bullish movement in the last 5 days. Chart DailyPattern Big MovementLength 5 CandlesIdentified 04-May-2019 04:00 UTC
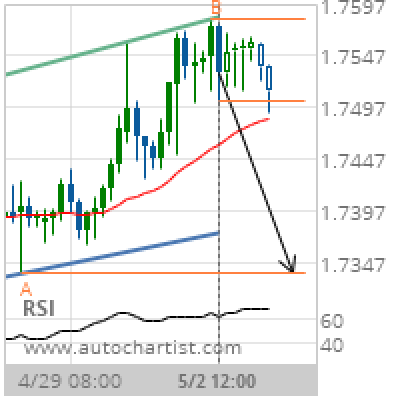
GBP/CAD Target Level: 1.7337
Channel Up identified at 02-May-2019 12:00 UTC. This pattern is still in the process of forming. Possible bearish price movement towards the support 1.7337 within the next day. Supported by RSI above 60 Chart 4 hourPattern Channel UpLength 46 CandlesIdentified 02-May-2019 12:00 UTC
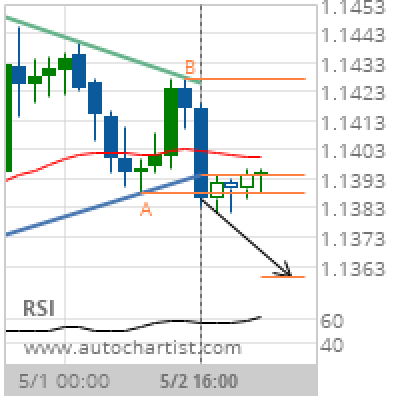
EUR/CHF Target Level: 1.1359
Triangle has broken through the support line at 02-May-2019 16:00 UTC. Possible bearish price movement forecast for the next 13 hours towards 1.1359. Supported by RSI above 60 Chart 4 hourPattern TriangleLength 23 CandlesIdentified 02-May-2019 16:00 UTC
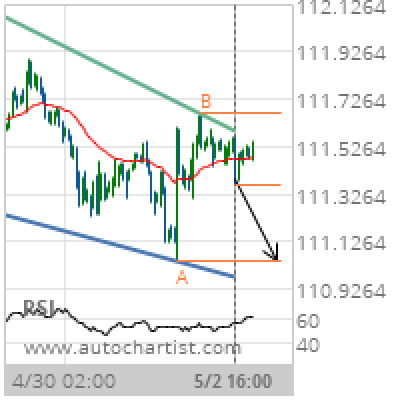
USD/JPY Target Level: 111.0440
Falling Wedge identified at 02-May-2019 16:00 UTC. This pattern is still in the process of forming. Possible bearish price movement towards the support 111.0440 within the next 2 days. Supported by RSI above 60 Chart 1 hourPattern Falling WedgeLength 140 CandlesIdentified 02-May-2019 16:00 UTC