
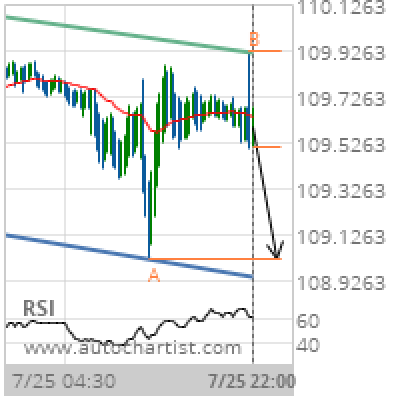
CHF/JPY Target Level: 109.0200
Channel Down identified at 25-Jul-2019 22:00 UTC. This pattern is still in the process of forming. Possible bearish price movement towards the support 109.0200 within the next 13 hours. Supported by RSI above 60 Chart 15 MinutesPattern Channel DownLength 153 CandlesIdentified 25-Jul-2019 22:00 UTC
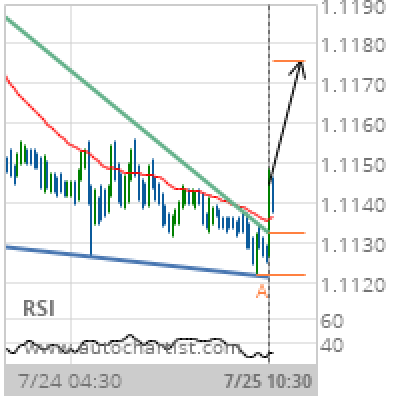
EUR/USD Target Level: 1.1175
Falling Wedge has broken through the resistance line at 25-Jul-2019 10:30 UTC. Possible bullish price movement forecast for the next 22 hours towards 1.1175. Supported by RSI below 40 Chart 30 MinutesPattern Falling WedgeLength 134 CandlesIdentified 25-Jul-2019 10:30 UTC
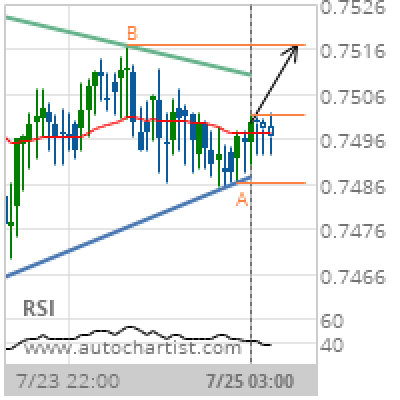
CAD/CHF Target Level: 0.7516
Triangle identified at 25-Jul-2019 03:00 UTC. This pattern is still in the process of forming. Possible bullish price movement towards the resistance 0.7516 within the next 18 hours. Supported by RSI below 40 Chart 1 hourPattern TriangleLength 66 CandlesIdentified 25-Jul-2019 03:00 UTC
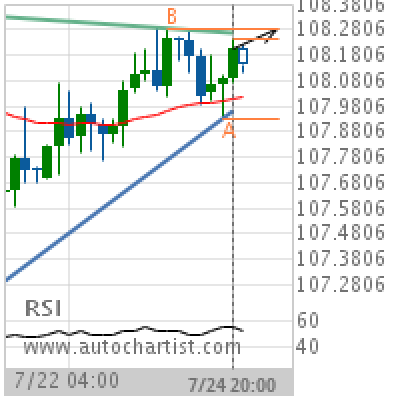
USD/JPY Target Level: 108.2850
Triangle identified at 24-Jul-2019 20:00 UTC. This pattern is still in the process of forming. Possible bullish price movement towards the resistance 108.2850 within the next 2 days. Supported by Upward sloping Moving Average Chart 4 hourPattern TriangleLength 37 CandlesIdentified 24-Jul-2019 20:00 UTC
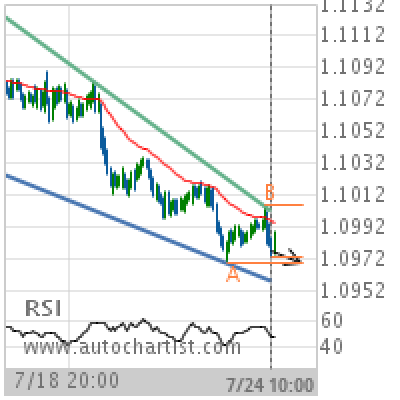
EUR/CHF Target Level: 1.0969
Falling Wedge identified at 24-Jul-2019 10:00 UTC. This pattern is still in the process of forming. Possible bearish price movement towards the support 1.0969 within the next 3 days. Supported by Downward sloping Moving Average Chart 1 hourPattern Falling WedgeLength 187 CandlesIdentified 24-Jul-2019 10:00 UTC
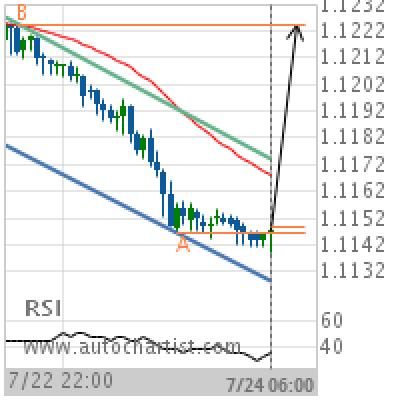
EUR/USD Target Level: 1.1224
Channel Down identified at 24-Jul-2019 06:00 UTC. This pattern is still in the process of forming. Possible bullish price movement towards the resistance 1.1224 within the next 22 hours. Supported by RSI below 40 Chart 1 hourPattern Channel DownLength 69 CandlesIdentified 24-Jul-2019 06:00 UTC
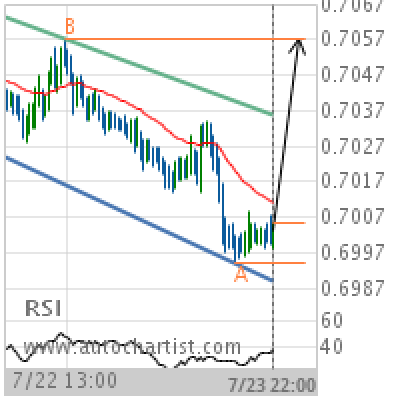
AUD/USD Target Level: 0.7057
Channel Down identified at 23-Jul-2019 22:00 UTC. This pattern is still in the process of forming. Possible bullish price movement towards the resistance 0.7057 within the next 24 hours. Supported by RSI below 40 Chart 30 MinutesPattern Channel DownLength 143 CandlesIdentified 23-Jul-2019 22:00 UTC
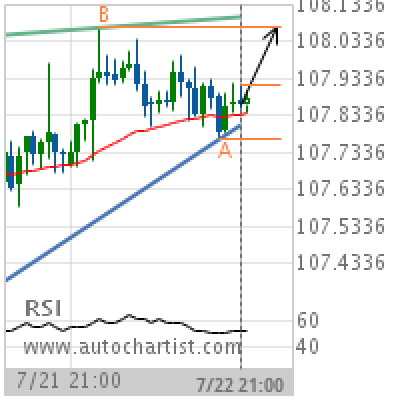
USD/JPY Target Level: 108.0690
Rising Wedge identified at 22-Jul-2019 21:00 UTC. This pattern is still in the process of forming. Possible bullish price movement towards the resistance 108.0690 within the next 17 hours. Supported by Upward sloping Moving Average Chart 1 hourPattern Rising WedgeLength 55 CandlesIdentified 22-Jul-2019 21:00 UTC
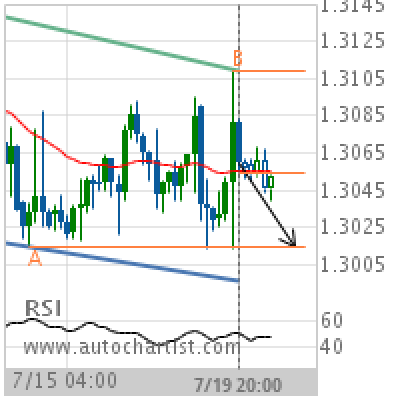
USD/CAD Target Level: 1.3015
Channel Down identified at 19-Jul-2019 20:00 UTC. This pattern is still in the process of forming. Possible bearish price movement towards the support 1.3015 within the next 17 hours. Supported by Downward sloping Moving Average Chart 4 hourPattern Channel DownLength 63 CandlesIdentified 19-Jul-2019 20:00 UTC
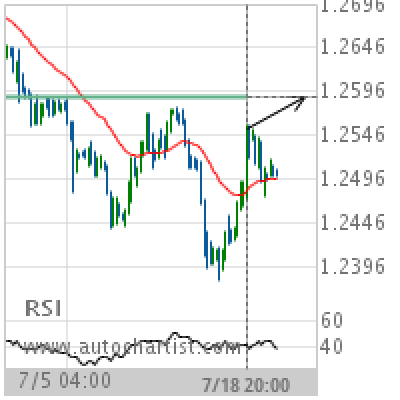
GBP/USD Target Level: 1.2591
Approaching Resistance level of 1.2591 identified at 18-Jul-2019 20:00 UTC Supported by RSI below 40 Chart 4 hourPattern ResistanceLength 136 CandlesIdentified 18-Jul-2019 20:00 UTC