
Day: October 23, 2019
20 posts
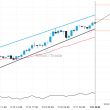
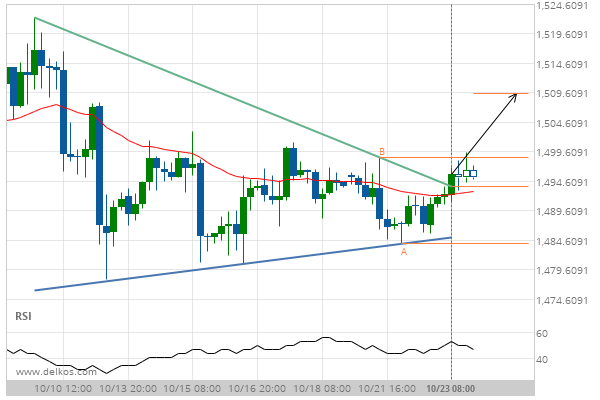
After testing resistance twice in the past, AUD/USD has finally broken through. Can we expect a bullish trend to follow?
The breakout of AUD/USD through the resistance line of a Channel Down could be a sign of the…
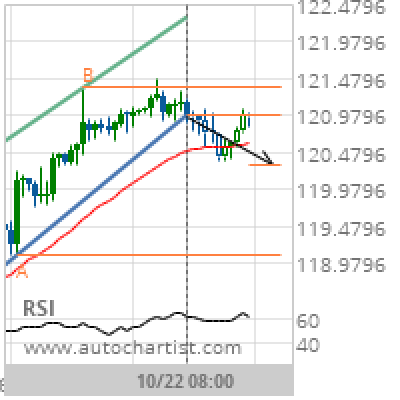
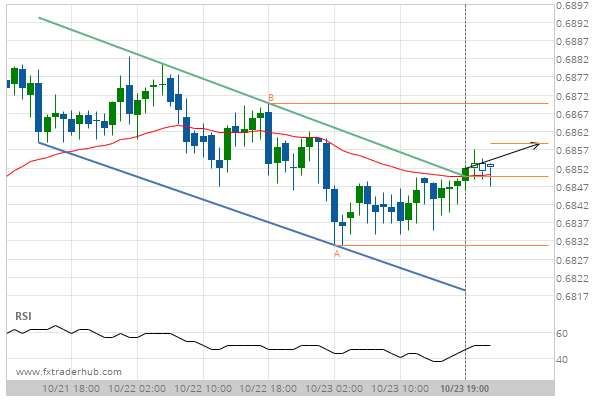
EUR/JPY Target Level: 120.3147
Channel Up has broken through the support line at 22-Oct-2019 08:00 UTC. Possible bearish price movement forecast for the next day towards 120.3147. Supported by RSI above 60 Chart 4 hourPattern Channel UpLength 51 CandlesIdentified 22-Oct-2019 08:00 UTC
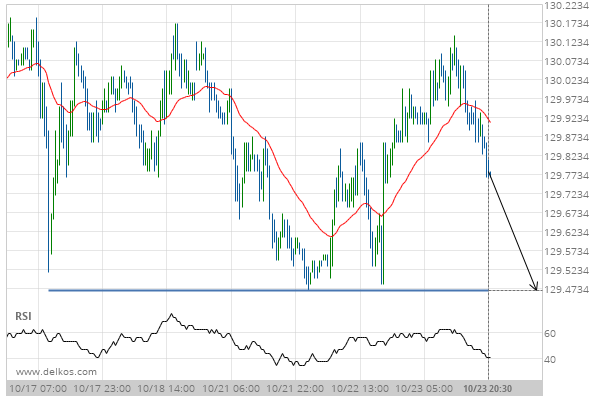
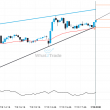
10 year US Treasury Note DECEMBER 2019 is quickly approaching 129.4688. We expect either a breakout through this line, or a rebound.
10 year US Treasury Note DECEMBER 2019 is heading towards a line of 129.4688. If this movement continues,…
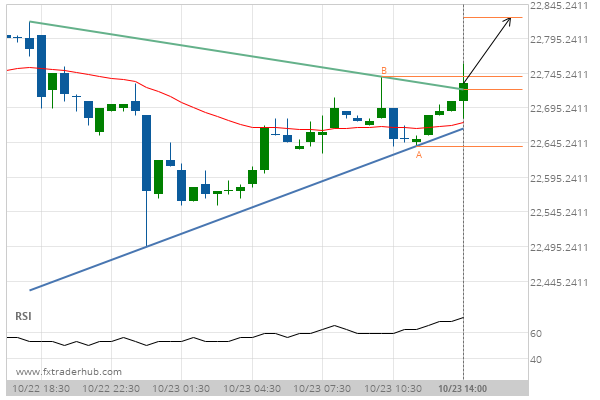
Breach of resistance could mean a start of a bullish trend on FRA40
FRA40 has broken through a resistance line of a Rectangle chart pattern. If this breakout holds true, we…
Breach of resistance could mean a start of a bullish trend on USD/JPY
USD/JPY has broken through a resistance line of a Flag chart pattern. If this breakout holds true, we…
Big movement expected on Gold DECEMBER 2019 after a breach of the resistance
Gold DECEMBER 2019 has broken through a resistance line of a Triangle and suggests a possible movement to…
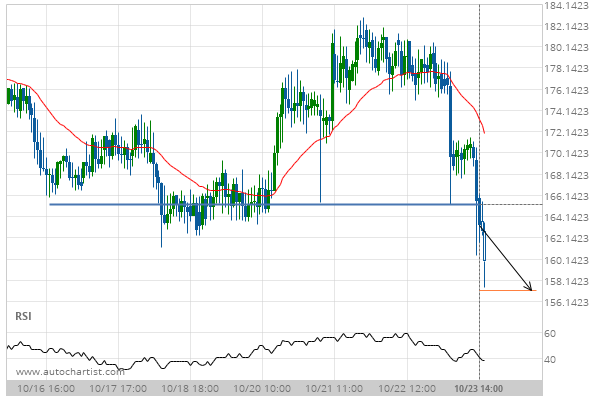
Breach of 165.2500 could mean a start of a bearish trend on BCHGBP
BCHGBP has broken through a line of 165.2500. If this breakout holds true, we expect the price of…
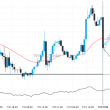
Breach of resistance could mean a start of a bullish trend on JPN225
JPN225 has broken through a resistance line of a Triangle chart pattern. If this breakout holds true, we…
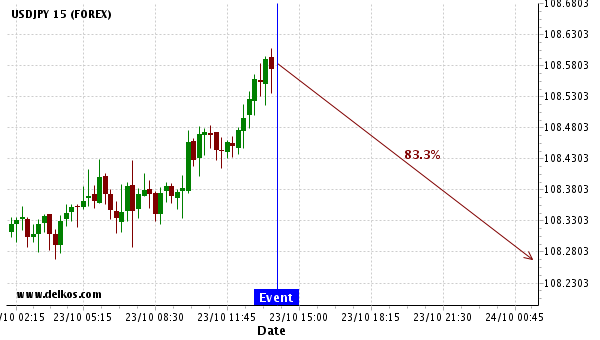
We expect USDJPY to trend downwards right now.
Historical events that allowed us to draw this conclusion 20 Jun 14:00 23 Apr 14:00 21 Mar 15:00…
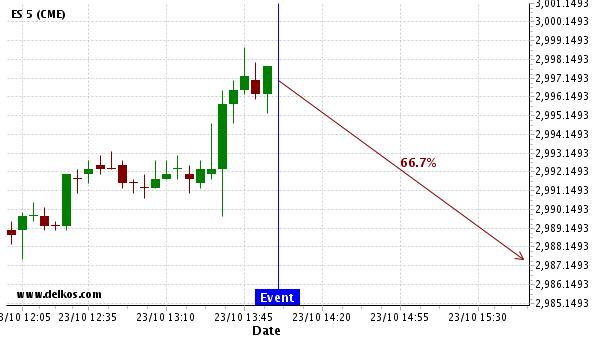
We expect ES to trend downwards right now.
Historical events that allowed us to draw this conclusion 22 Aug 14:00 20 Jun 14:00 21 Dec 15:00…