
Day: October 15, 2019
24 posts
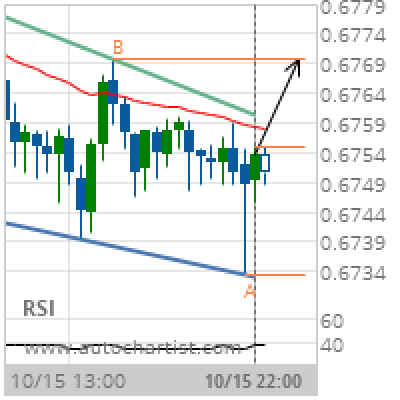
AUD/USD Target Level: 0.6769
Falling Wedge identified at 15-Oct-2019 22:00 UTC. This pattern is still in the process of forming. Possible bullish price movement towards the resistance 0.6769 within the next 7 hours. Supported by RSI below 40 Chart 30 MinutesPattern Falling WedgeLength 40 CandlesIdentified 15-Oct-2019 22:00 UTC
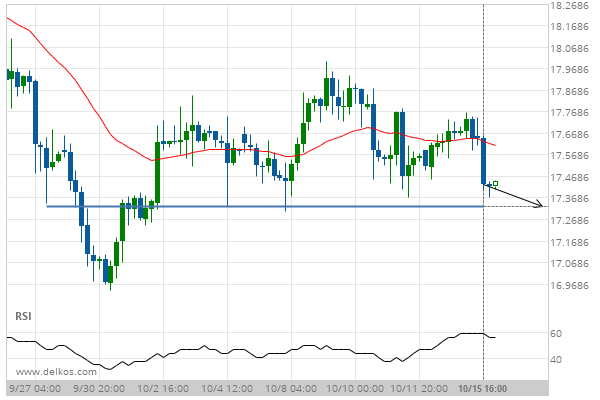
Silver DECEMBER 2019 is quickly approaching 17.3300. We expect either a breakout through this line, or a rebound.
Silver DECEMBER 2019 is heading towards a line of 17.3300. If this movement continues, we expect the price…

Big movement expected on Travelers Cos Inc. after a breach of the support
Travelers Cos Inc. has broken through a support line of a Rising Wedge and suggests a possible movement…
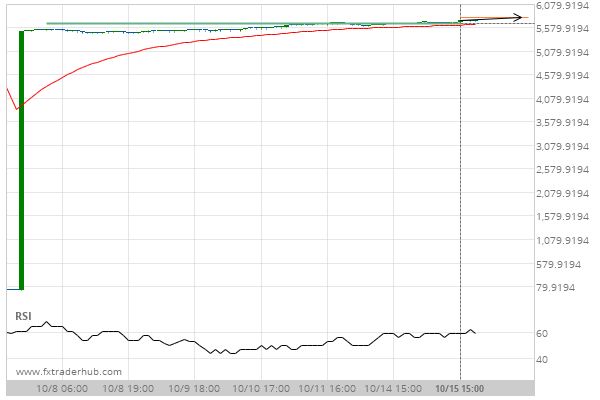
Breach of 5675.0000 could mean a start of a bullish trend on FRA40
FRA40 has broken through a line of 5675.0000. If this breakout holds true, we expect the price of…
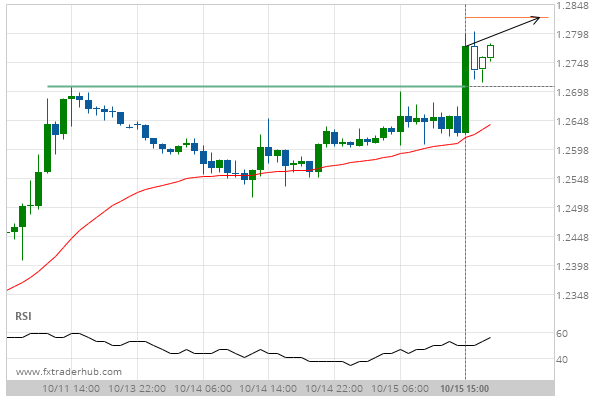
Breach of 1.2707 could mean a start of a bullish trend on GBP/USD
GBP/USD has broken through a line of 1.2707. If this breakout holds true, we expect the price of…
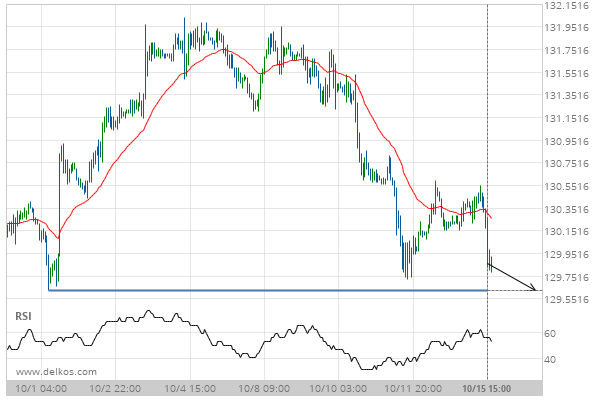
A final push expected on 10 year US Treasury Note DECEMBER 2019 as it starts approaching a price line of 129.6250.
10 year US Treasury Note DECEMBER 2019 is heading towards a price line of 129.6250 and could reach…
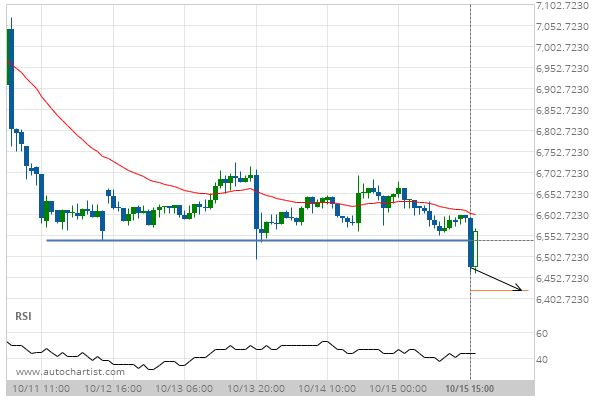
Big movement expected on BTCGBP after a breach of 6541.0000
BTCGBP has broken through a line of 6541.0000 and suggests a possible movement to 6421.8398 within the next…
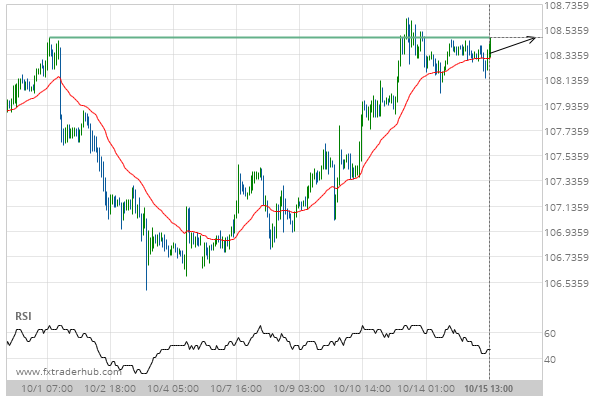
USD/JPY is quickly approaching 108.4730. We expect either a breakout through this line, or a rebound.
USD/JPY is heading towards a line of 108.4730. If this movement continues, we expect the price of USD/JPY…
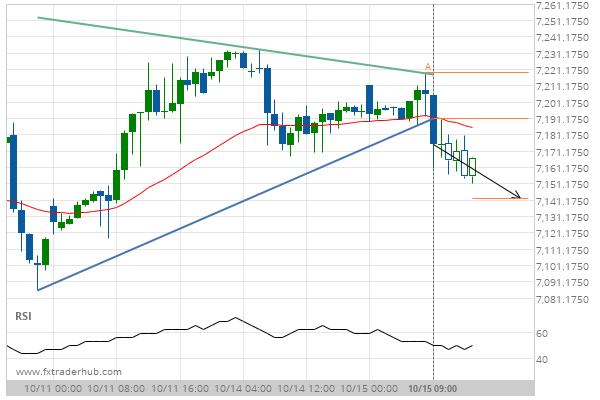
Breach of support could mean a start of a bearish trend on UK100
UK100 has broken through a support line of a Triangle chart pattern. If this breakout holds true, we…
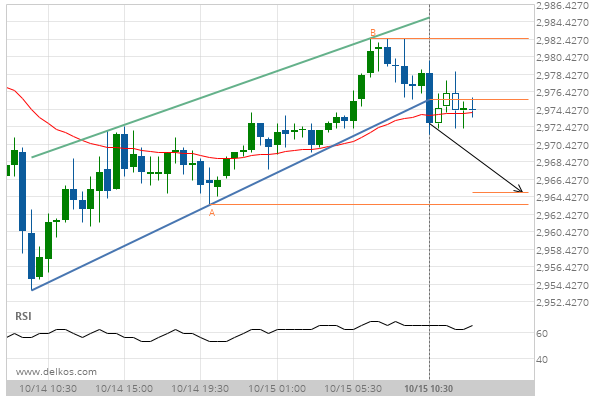
Breach of support could mean a start of a bearish trend on E-mini S&P 500 DECEMBER 2019
E-mini S&P 500 DECEMBER 2019 has broken through a support line of a Channel Up chart pattern. If…