
Day: October 13, 2019
3 posts
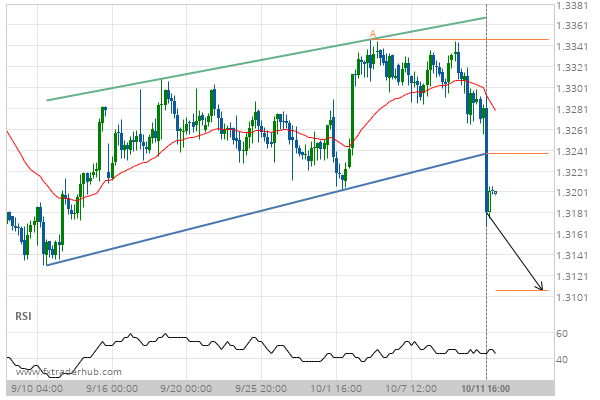
Breach of support could mean a start of a bearish trend on USD/CAD
USD/CAD has broken through a support line of a Channel Up chart pattern. If this breakout holds true,…
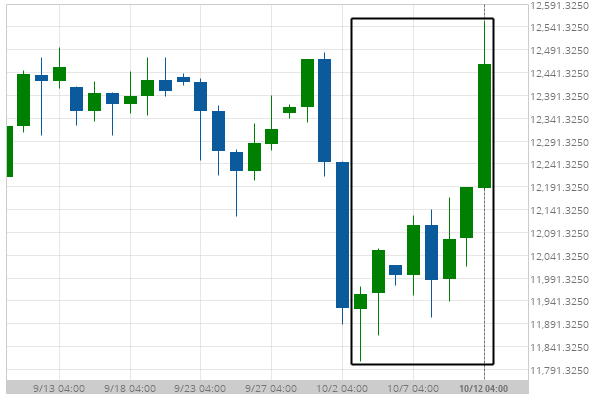
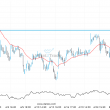
After experiencing a 4.5% bullish move in the space of 10 days, nobody knows where GER30 is headed.
Those of you that are trend followers are probably eagerly watching GER30 to see if its latest 4.5%…
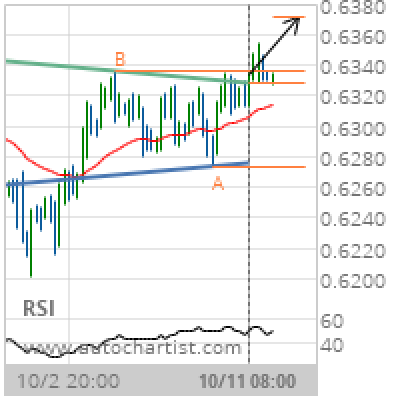
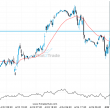
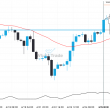
NZD/USD Target Level: 0.6371
Inverse Head and Shoulders has broken through the resistance line at 11-Oct-2019 08:00 UTC. Possible bullish price movement forecast for the next 2 days towards 0.6371. Supported by Upward sloping Moving Average Chart 4 hourPattern Inverse Head and ShouldersLength 90 CandlesIdentified 11-Oct-2019 08:00 UTC