
Day: September 13, 2019
28 posts

Important resistance line being approached by SPX500. This price has been tested numerous time in the last 2 days
SPX500 is moving towards the resistance line of a Ascending Triangle which it has tested numerous times in…
BCHAUD – approaching a resistance line that has been previously tested at least twice in the past
BCHAUD is moving towards the resistance line of a Triangle. Because we have seen it retrace from this…
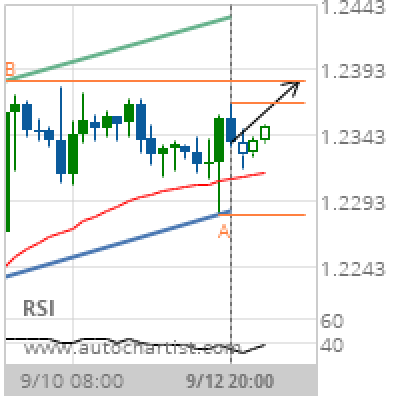
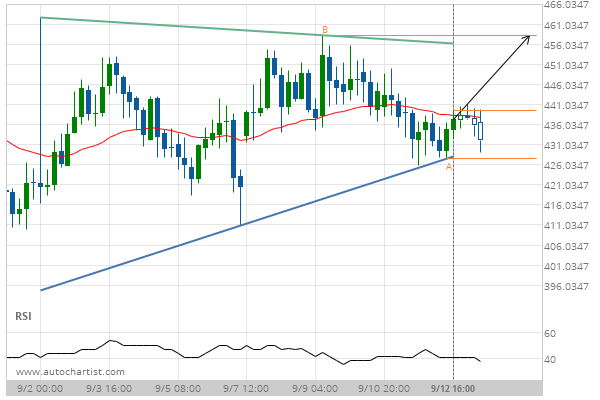
GBP/USD Target Level: 1.2385
Channel Up identified at 12-Sep-2019 20:00 UTC. This pattern is still in the process of forming. Possible bullish price movement towards the resistance 1.2385 within the next day. Supported by RSI below 40 Chart 4 hourPattern Channel UpLength 33 CandlesIdentified 12-Sep-2019 20:00 UTC
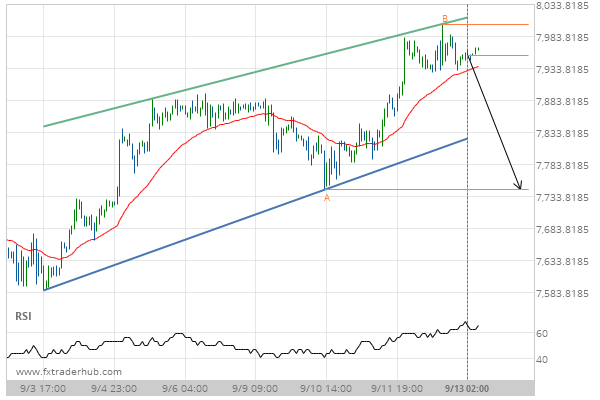
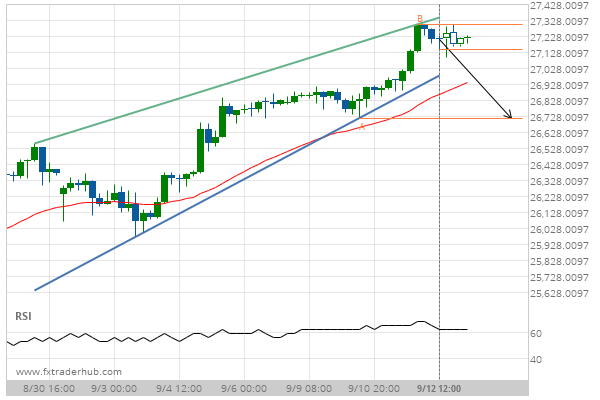
NAS100 – approaching a support line that has been previously tested at least twice in the past
NAS100 is moving towards the support line of a Channel Up. Because we have seen it retrace from…
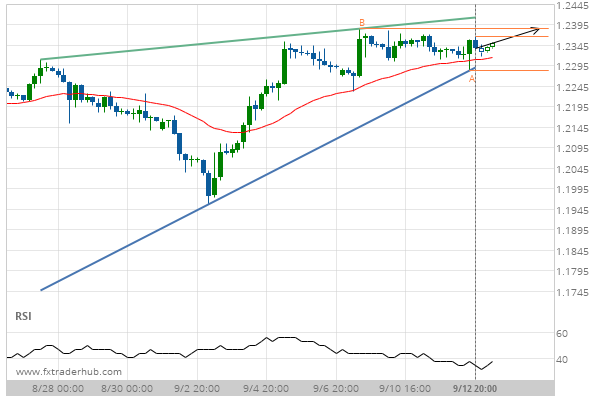
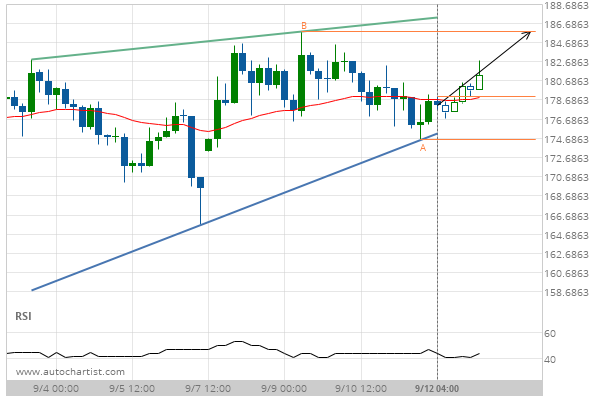
A quick move expected on GBP/USD as it starts approaching a resistance line of a Rising Wedge
GBP/USD is heading towards the resistance line of a Rising Wedge and could reach this point within the…
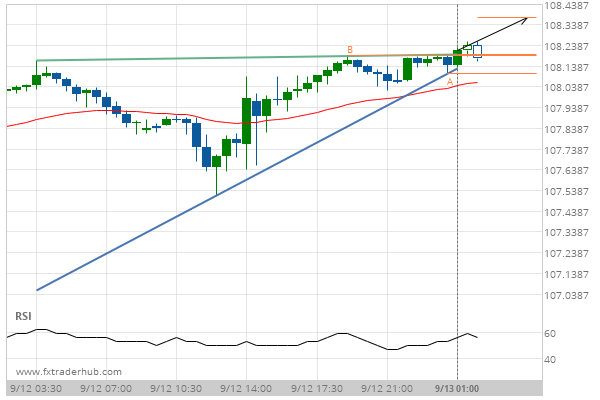
Breach of resistance could mean a start of a bullish trend on USD/JPY
USD/JPY has broken through a resistance line of a Ascending Triangle chart pattern. If this breakout holds true,…
US30 is quickly approaching the support line of a Rising Wedge. We expect either a breakout through this line or a rebound.
US30 is heading towards the support line of a Rising Wedge. If this movement continues, we expect the…
Important resistance line being approached by ETHUSD. This price has been tested numerous time in the last 9 days
ETHUSD is moving towards the resistance line of a Rising Wedge which it has tested numerous times in…