
Day: September 1, 2019
3 posts
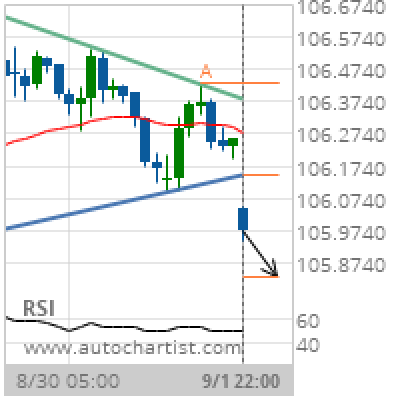
USD/JPY Target Level: 105.8333
Triangle has broken through the support line at 01-Sep-2019 22:00 UTC. Possible bearish price movement forecast for the next 12 hours towards 105.8333. Supported by Downward sloping Moving Average Chart 1 hourPattern TriangleLength 39 CandlesIdentified 01-Sep-2019 22:00 UTC
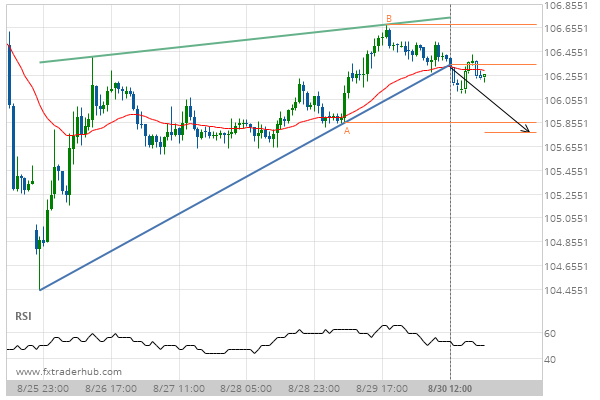
After testing support twice in the past, USD/JPY has finally broken through. Can we expect a bearish trend to follow?
The breakout of USD/JPY through the support line of a Rising Wedge could be a sign of the…
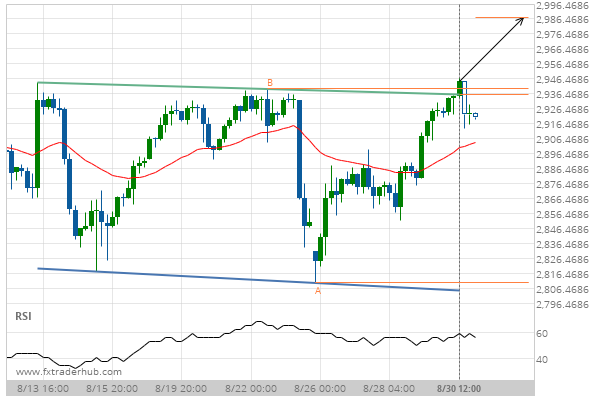
After testing resistance twice in the past, SPX500 has finally broken through. Can we expect a bullish trend to follow?
The breakout of SPX500 through the resistance line of a Rectangle could be a sign of the road…