
Day: July 9, 2019
19 posts
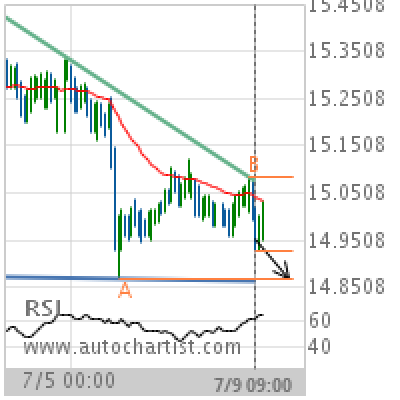
XAG/USD Target Level: 14.8700
Descending Triangle identified at 09-Jul-2019 09:00 UTC. This pattern is still in the process of forming. Possible bearish price movement towards the support 14.8700 within the next 2 days. Supported by RSI above 60 Chart 1 hourPattern Descending TriangleLength 127 CandlesIdentified 09-Jul-2019 09:00 UTC
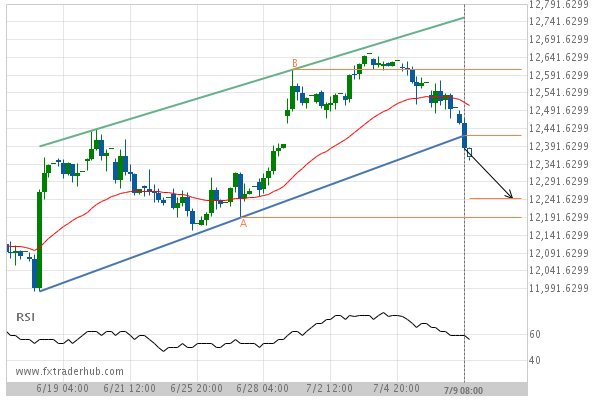
Support line breached by GER30. This price has been tested at least twice before.
GER30 has broken through the support line which it has tested twice in the past. We have seen…
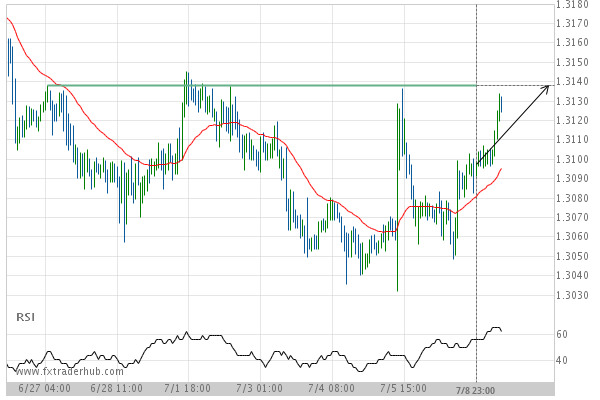
After testing 1.3138 numerous times, USD/CAD is once again approaching this price point. Can we expect a bullish trend to follow?
The movement of USD/CAD towards 1.3138 price line is yet another test of the line it reached numerous…
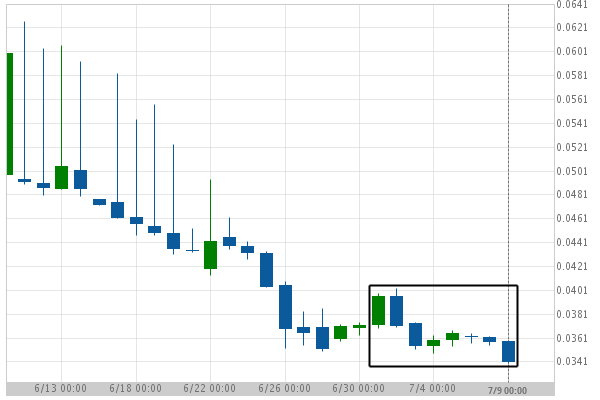
BCHBTC hits 0.034 after a 8.47% move spanning 9 days
For those of you that don’t believe in trends, this may be an opportunity to take advantage of…
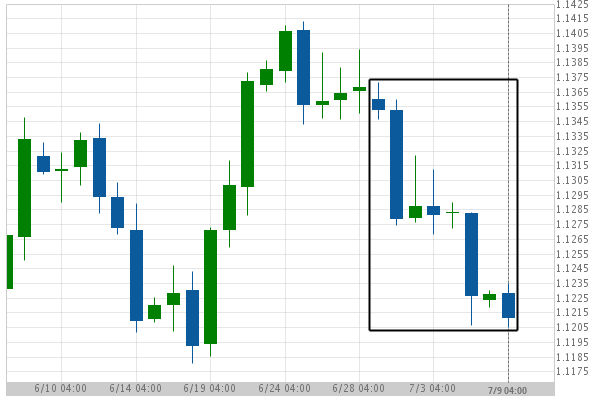
EUR/USD hits 1.121 after a 1.31% move spanning 10 days
For those of you that don’t believe in trends, this may be an opportunity to take advantage of…
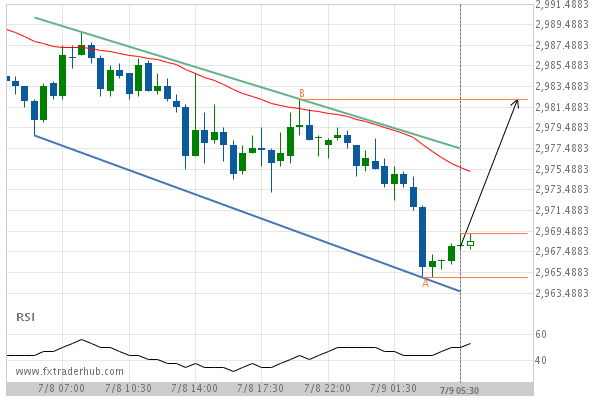
Important resistance line being approached by SPX500. This price has been tested numerous time in the last 2 days
SPX500 is moving towards the resistance line of a Channel Down which it has tested numerous times in…
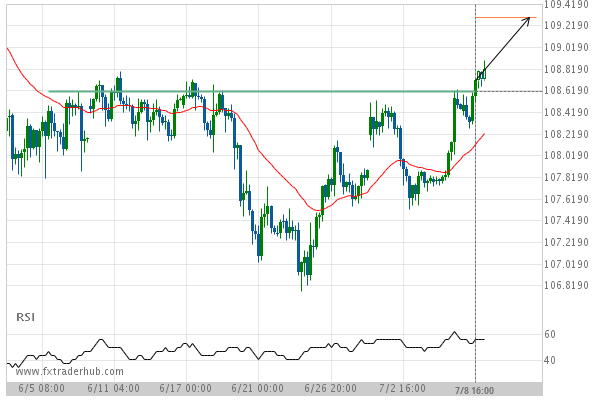
Breach of 108.6150 could mean a start of a bullish trend on USD/JPY
USD/JPY has broken through a line of 108.6150. If this breakout holds true, we expect the price of…
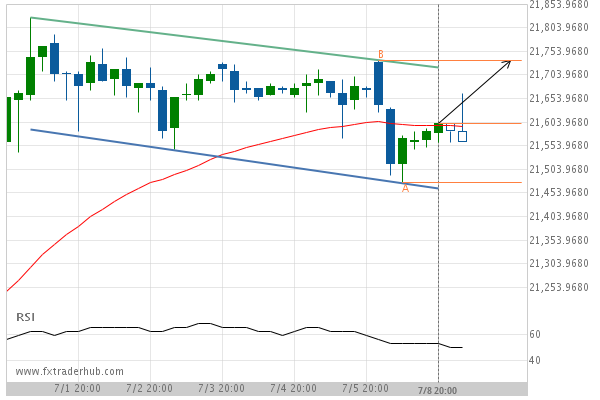
JPN225 is quickly approaching the resistance line of a Channel Down. We expect either a breakout through this line or a rebound.
JPN225 is heading towards the resistance line of a Channel Down. If this movement continues, we expect the…
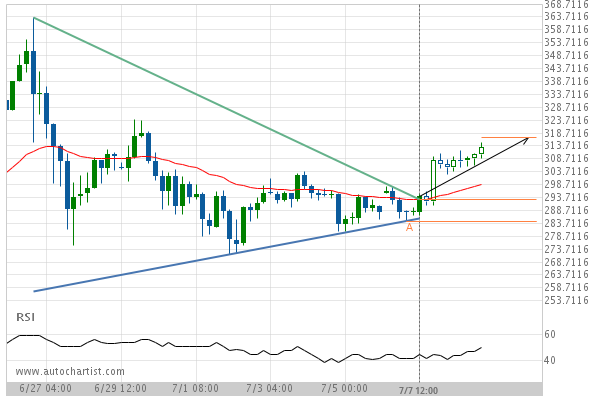
After testing resistance twice in the past, ETHUSD has finally broken through. Can we expect a bullish trend to follow?
The breakout of ETHUSD through the resistance line of a Triangle could be a sign of the road…