
Day: June 26, 2019
18 posts
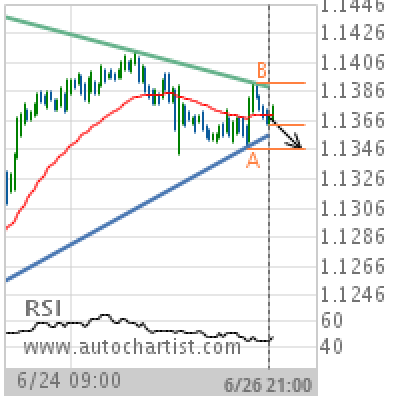
EUR/USD Target Level: 1.1347
Triangle identified at 26-Jun-2019 21:00 UTC. This pattern is still in the process of forming. Possible bearish price movement towards the support 1.1347 within the next 2 days. Supported by Downward sloping Moving Average Chart 1 hourPattern TriangleLength 133 CandlesIdentified 26-Jun-2019 21:00 UTC
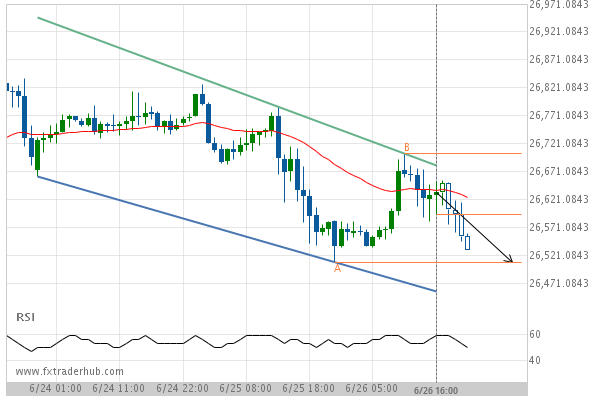
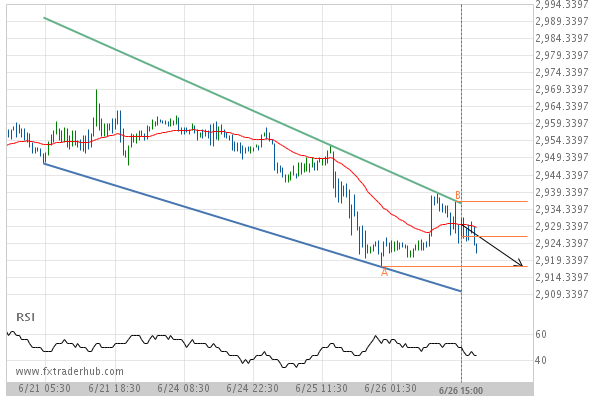
US30 is approaching a support line of a Channel Down. It has touched this line numerous times in the last 3 days.
US30 is approaching the support line of a Channel Down. It has touched this line numerous times in…
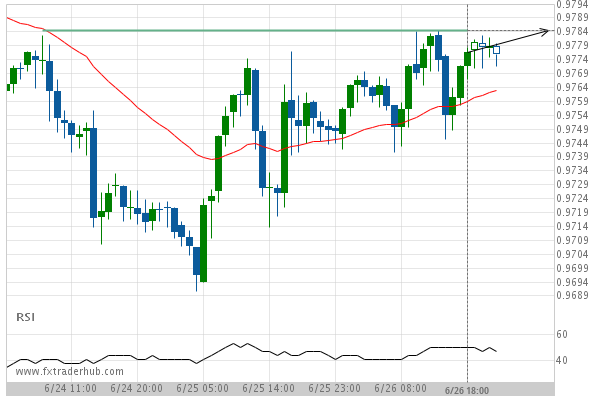
After testing 0.9785 numerous times, USD/CHF is once again approaching this price point. Can we expect a bullish trend to follow?
The movement of USD/CHF towards 0.9785 price line is yet another test of the line it reached numerous…
US Treasury Bond SEPTEMBER 2019 is approaching the support line of a Support. It has touched this line numerous times in the last 9 days.
US Treasury Bond SEPTEMBER 2019 is approaching the support line of a Support. It has touched this line…
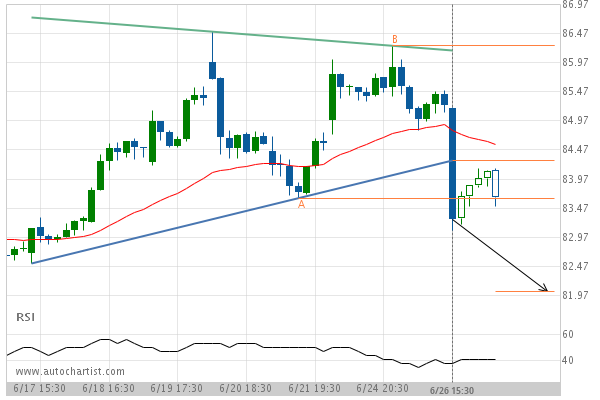
After testing support twice in the past, Merck & Co. Inc. has finally broken through. Can we expect a bearish trend to follow?
The breakout of Merck & Co. Inc. through the support line of a Triangle could be a sign…
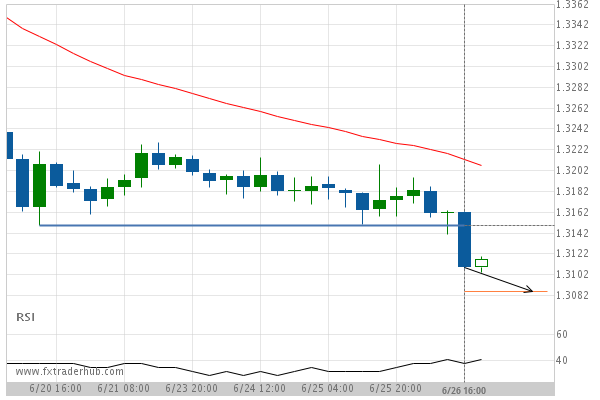
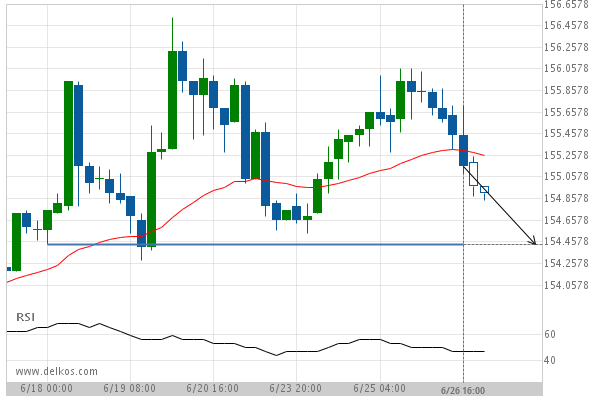
After testing 1.3149 numerous times, USD/CAD has finally broken through. Can we expect a bearish trend to follow?
The breakout of USD/CAD through the 1.3149 price line is a breach of an important psychological price that…
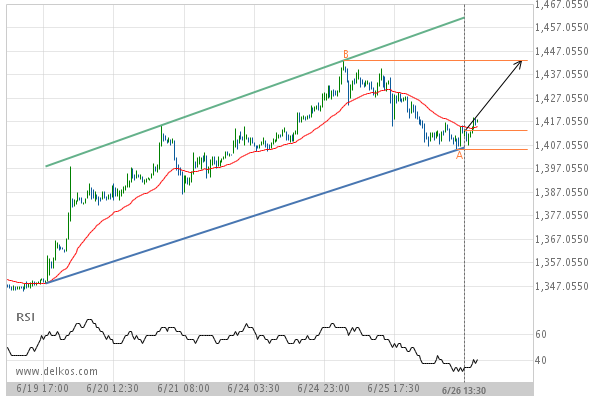
SPX500 is approaching a support line of a Falling Wedge. It has touched this line numerous times in the last 6 days.
SPX500 is approaching the support line of a Falling Wedge. It has touched this line numerous times in…
Gold AUGUST 2019 is approaching a resistance line of a Channel Up. It has touched this line numerous times in the last 7 days.
Gold AUGUST 2019 is approaching the resistance line of a Channel Up. It has touched this line numerous…
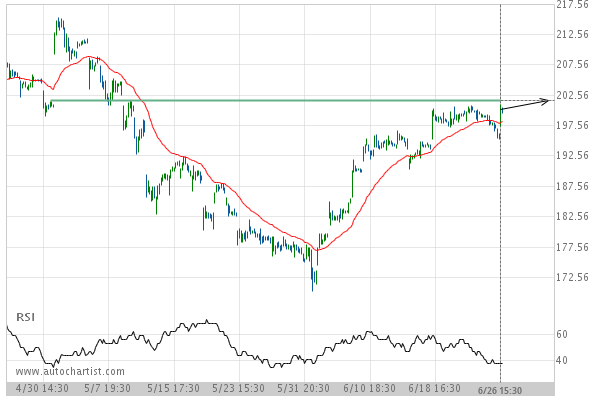
After testing 201.68 numerous times, Apple Inc. is once again approaching this price point. Can we expect a bullish trend to follow?
The movement of Apple Inc. towards 201.68 price line is yet another test of the line it reached…
After testing resistance twice in the past, BCHCAD has finally broken through. Can we expect a bullish trend to follow?
The breakout of BCHCAD through the resistance line of a Triangle could be a sign of the road…