
Day: June 18, 2019
15 posts
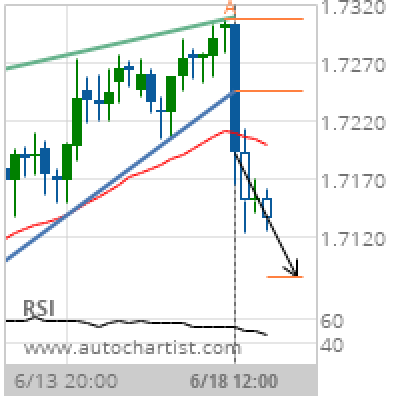
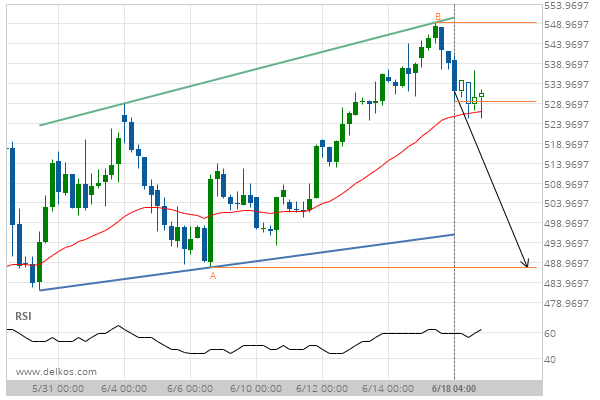
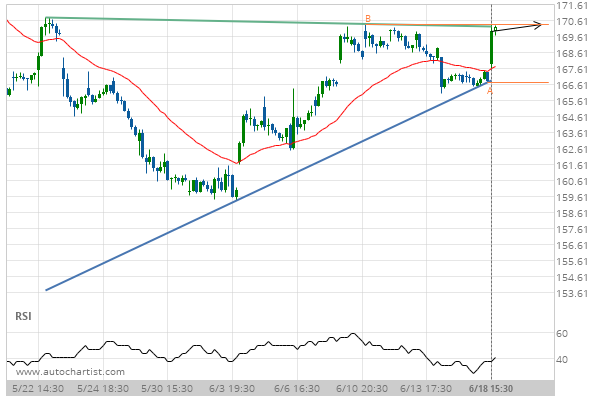
EUR/NZD Target Level: 1.7086
Rising Wedge has broken through the support line at 18-Jun-2019 12:00 UTC. Possible bearish price movement forecast for the next 2 days towards 1.7086. Supported by Downward sloping Moving Average Chart 4 hourPattern Rising WedgeLength 39 CandlesIdentified 18-Jun-2019 12:00 UTC
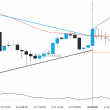
A quick move expected on Wheat JULY 2019 as it starts approaching a support line of a Channel Up
Wheat JULY 2019 is heading towards the support line of a Channel Up and could reach this point…
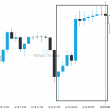
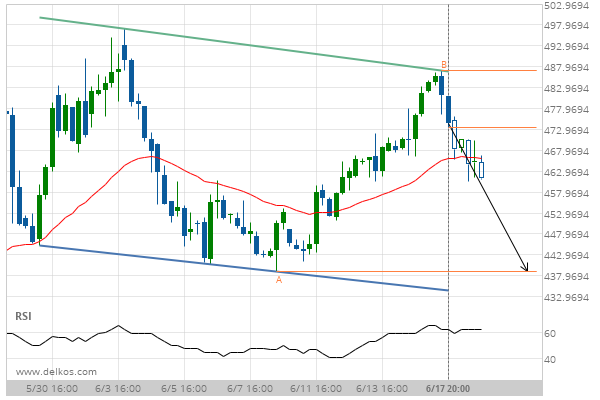
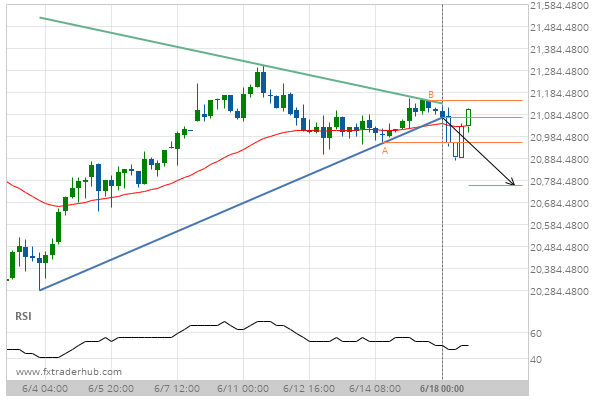
A quick move expected on General Electric Co. as it starts approaching a resistance line of a Rising Wedge
General Electric Co. is heading towards the resistance line of a Rising Wedge and could reach this point…
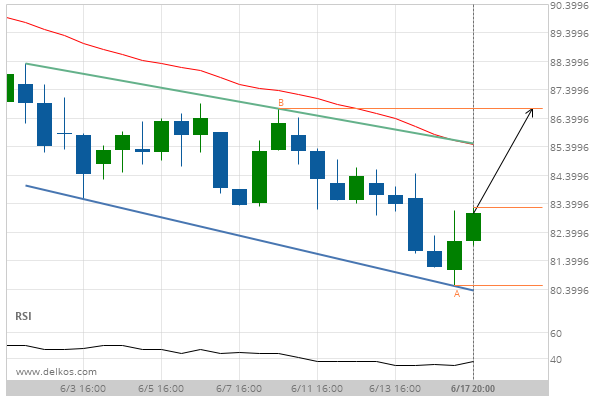
A quick move expected on KC HRW Wheat JULY 2019 as it starts approaching a support line of a Channel Down
KC HRW Wheat JULY 2019 is heading towards the support line of a Channel Down and could reach…
After experiencing a 17.16% bullish move in the space of 10 days, nobody knows where BTCCAD is headed.
Those of you that are trend followers are probably eagerly watching BTCCAD to see if its latest 17.16%…
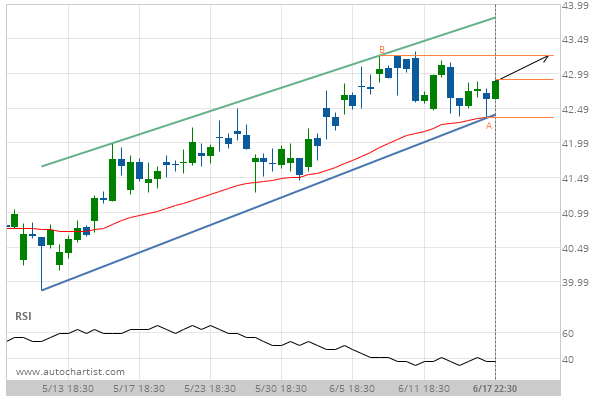
3m Co. is approaching a resistance line of a Ascending Triangle. It has touched this line numerous times in the last 27 days.
3m Co. is approaching the resistance line of a Ascending Triangle. It has touched this line numerous times…
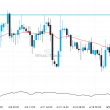
Support line breached by JPN225. This price has been tested at least twice before.
JPN225 has broken through the support line which it has tested twice in the past. We have seen…
A quick move expected on Lean Hogs JULY 2019 as it starts approaching a resistance line of a Channel Down
Lean Hogs JULY 2019 is heading towards the resistance line of a Channel Down and could reach this…
A quick move expected on Pfizer Inc. as it starts approaching a resistance line of a Channel Up
Pfizer Inc. is heading towards the resistance line of a Channel Up and could reach this point within…
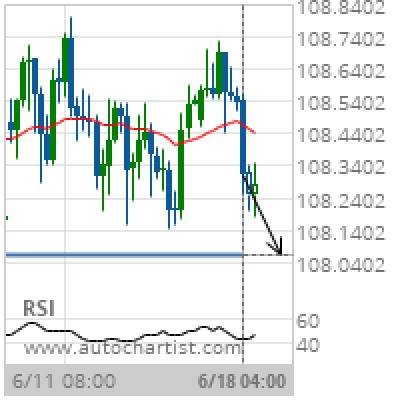
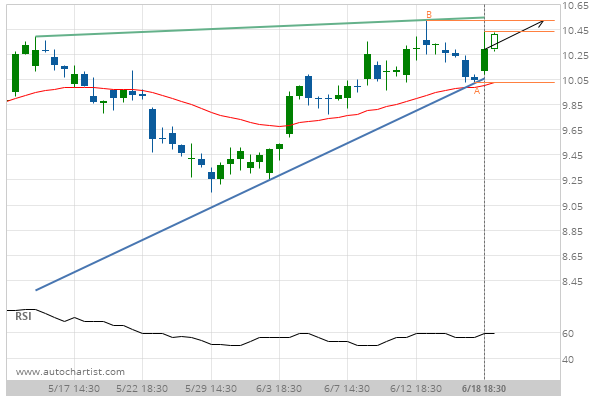
USD/JPY Target Level: 108.0630
Approaching Support level of 108.0630 identified at 18-Jun-2019 04:00 UTC Supported by Downward sloping Moving Average Chart 4 hourPattern SupportLength 68 CandlesIdentified 18-Jun-2019 04:00 UTC