
Day: May 29, 2019
14 posts
CHF/JPY Target Level: 109.4200
Flag identified at 29-May-2019 04:00 UTC. This pattern is still in the process of forming. Possible bullish price movement towards the resistance 109.4200 within the next 16 hours. Supported by RSI below 40 Chart 4 hourPattern FlagLength 28 CandlesIdentified 29-May-2019 04:00 UTC
Important resistance line being approached by FRA40. This price has been tested numerous time in the last 8 days
FRA40 is moving towards the resistance line of a Channel Down which it has tested numerous times in…
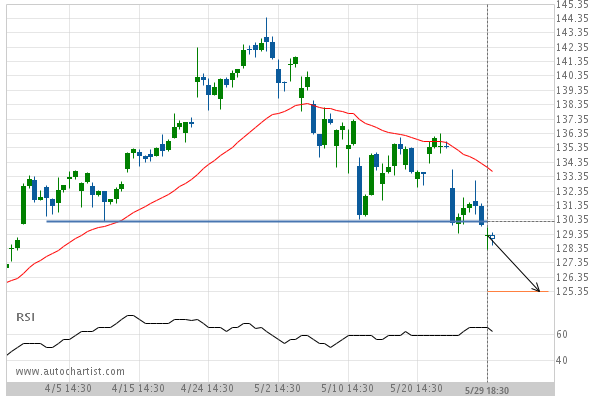
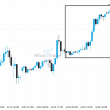
Big movement expected on United Technologies Corp. after a breach of 130.26
United Technologies Corp. has broken through a line of 130.26 and suggests a possible movement to 125.38 within…
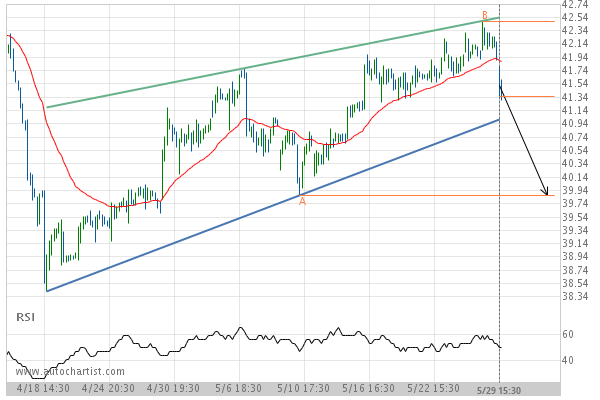
Important support line being approached by Pfizer Inc.. This price has been tested numerous time in the last 42 days
Pfizer Inc. is moving towards the support line of a Rising Wedge which it has tested numerous times…
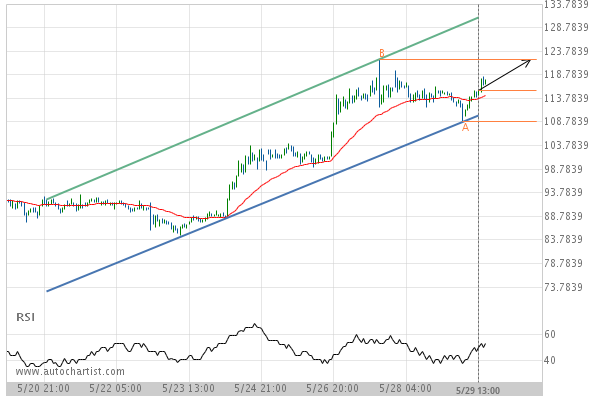
LTCUSD is approaching a resistance line of a Channel Up. It has touched this line numerous times in the last 9 days.
LTCUSD is approaching the resistance line of a Channel Up. It has touched this line numerous times in…
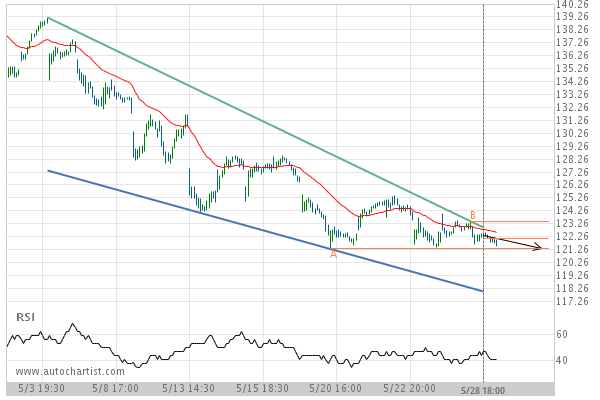
After testing the support line numerous times, Caterpillar Inc. is once again approaching this line. Can we expect a bearish trend to follow?
The movement of Caterpillar Inc. towards the support line of a Falling Wedge is yet another test of…
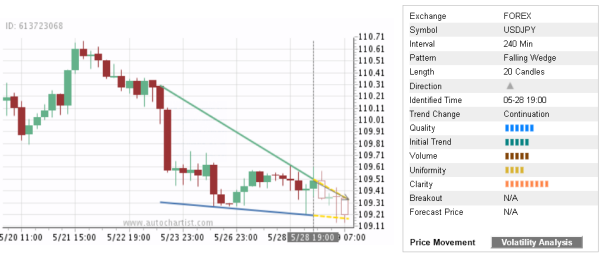
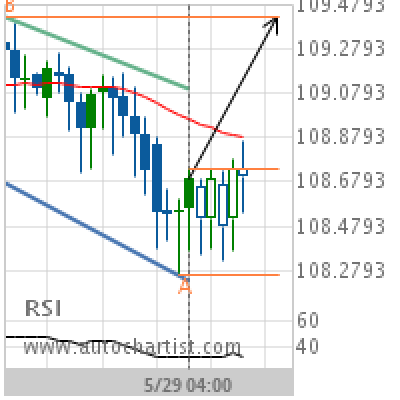
Trade of the Day: USD/JPY
By: Dima Chernovolov USD/JPY continues to rise inside the 4-hour Falling Wedge chart pattern which was previously identified by Autochartist. Autochartist rates the quality of this Falling Wedge at the 6-bar level – which is the result of the medium Initial Trend (5 bars), lower Uniformity (4 bars) and near-maximum Clarity (9 bars). USD/JPY is…
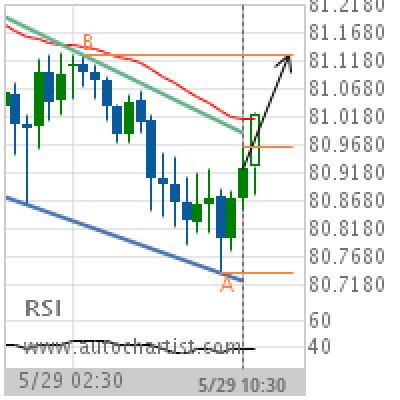
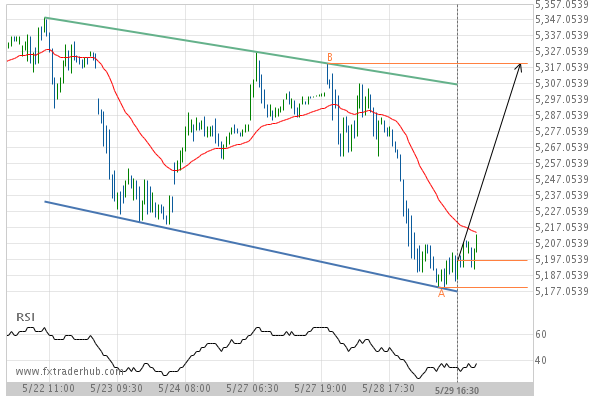
CAD/JPY Target Level: 81.1260
Channel Down identified at 29-May-2019 10:30 UTC. This pattern is still in the process of forming. Possible bullish price movement towards the resistance 81.1260 within the next 6 hours. Supported by RSI below 40 Chart 30 MinutesPattern Channel DownLength 38 CandlesIdentified 29-May-2019 10:30 UTC
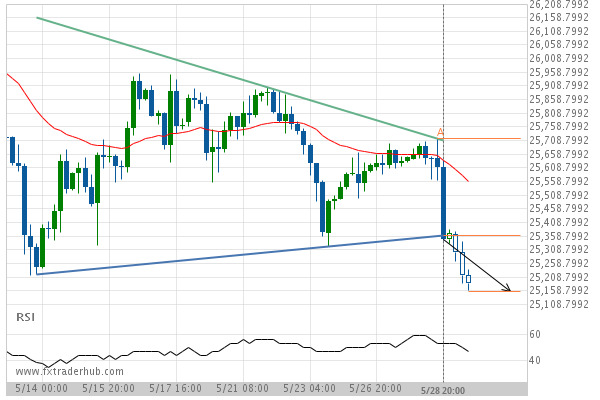
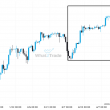
After testing support twice in the past, US30 has finally broken through. Can we expect a bearish trend to follow?
The breakout of US30 through the support line of a Triangle could be a sign of the road…
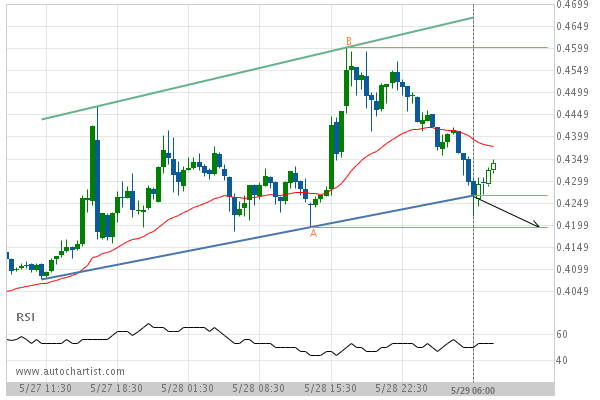
Big movement expected on XRPUSD after a breach of the support
XRPUSD has broken through a support line of a Channel Up and suggests a possible movement to 0.4193…